


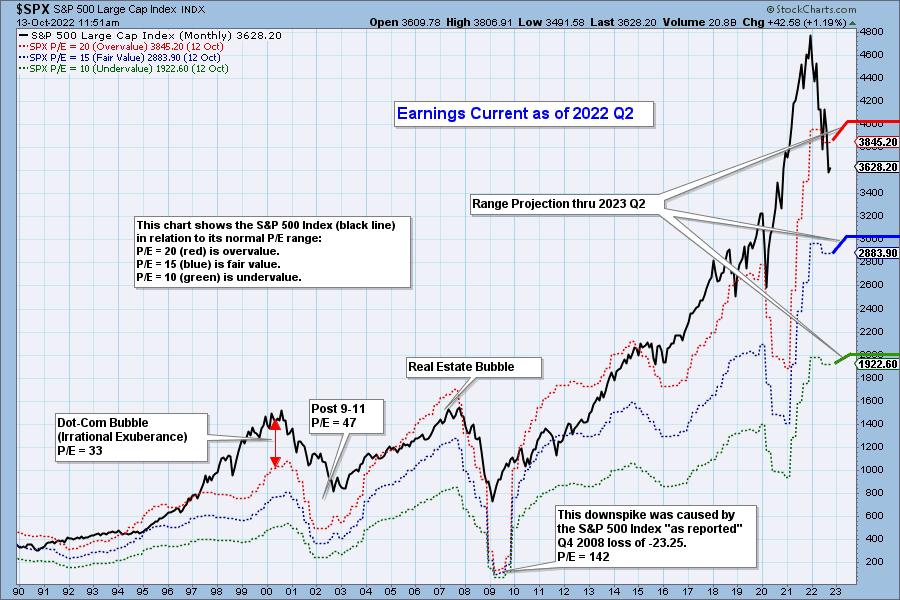
The following chart shows us the normal value range of the S&P 500 Index, indicating where the S&P 500 would have to be in order to have an overvalued P/E of 20 (red line), a fairly valued P/E of 15 (blue line), or an undervalued P/E of 10 (green line). Annotations on the right side of the chart show where the range is projected to be based upon earnings estimates for the next four quarters, through 2023 Q2. Note that actual earnings peaked in Q2, and earnings projections are flattening.
Historically, price has usually remained below the top of the normal value range (red line); however, since about 1998, it has not been uncommon for price to exceed normal overvalue levels, sometimes by a lot. The market has been mostly overvalued since 1992, and it has not been undervalued since 1984. We could say that this is the “new normal,” except that it isn’t normal by GAAP (Generally Accepted Accounting Principles) standards.
We use GAAP earnings as the basis for our analysis. The table below shows earnings projections through June 2023. Keep in mind that the P/E estimates are calculated based upon the S&P 500 close as of September 30, 2022. They will change daily depending on where the market goes from here. It is notable that the P/E is finally within the normal range, albeit still in the overvalued side of the range.
The following table shows where the bands are projected be, based upon earnings estimates through 2023 Q1.
This DecisionPoint chart keeps track of S&P 500 fundamentals, P/E and yield, and it is updated daily — not that you need to watch it that closely, but it is up-to-date when you need it.
CONCLUSION: With a P/E of 18.6, earnings are within the normal range, but the market is still overvalued; however, earnings have begun to fall causing the normal range to fall as well. Perhaps the bright side of the bear market is that falling prices will keep valuations within the normal range.
Technical Analysis is a windsock, not a crystal ball. –Carl Swenlin
(c) Copyright 2022 DecisionPoint.com
Helpful DecisionPoint Links:
DecisionPoint Alert Chart List
DecisionPoint Golden Cross/Silver Cross Index Chart List
DecisionPoint Sector Chart List
DecisionPoint Chart Gallery
Trend Models
Price Momentum Oscillator (PMO)
On Balance Volume
Swenlin Trading Oscillators (STO-B and STO-V)
ITBM and ITVM
SCTR Ranking
Bear Market Rules Earnings


