ADANIPORTS has been showing some potent technical developments on the longer-term timeframe charts. While most of the Adani Group stocks have run up too high and ahead of the curve, this stock has been consolidating in a wide and well-defined trading range and has formed a great base for itself. The price action seen over the past months is more like that of a stock laying strong foundations before beginning a strong directional move on the upside.
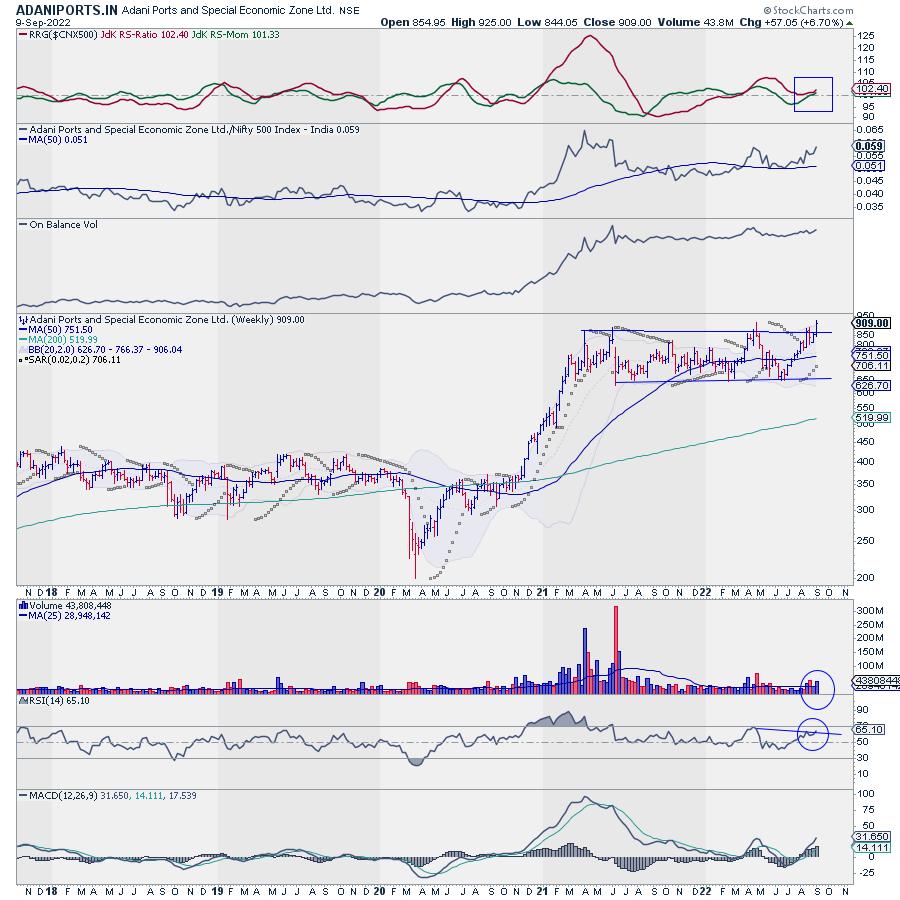
The first such indication has come from the Relative Strength Analysis of Adani Ports against the broader NIFTY500 Index. The weekly RS line of ADANIPORTS against the broader NIFTY500 Index has not only inched higher above the 50-Period MA, but it has also broken out from a pattern. The RS Line has penetrated the falling trend line; the coming days may see much improved relative performance of this stock against the markets in general.
The weekly chart of ADANIPORTS shows a very interesting technical pattern that has got developed over the past quarters. The stock saw a decisive breakout above 372 levels in November 2020. Following a strong move after that on the upside, the stock went on to mark the high point at 885 in April 2021.
After marking this high point, the stock has traded sideways in a 200-odd Rs. trading range and has not taken any directional bias after that. Although there have been a couple of events when the stock tried to break out of this trading zone, it was not able to do so and each time it ended up returning back inside this broad trading range.
The result of this price behavior was the formation of a Rectangle Pattern that has developed over the past 17 months beginning April 2021.
The most recent price action shows that the stock may once again attempt to stage a breakout from this pattern. The weekly MACD is bullish and above the signal line. The RSI is marked a 14-period high which is bullish; it also remains neutral and does not show any divergence against the price.
The stock also has had a continued PSAR buy signal for the last couple of weeks. It has rolled inside the leading quadrant of the Relative Rotation Graph (RRG) when benchmarked against the broader NIFTY500 Index.
If the breakout occurs on the expected lines and if the stock moves in the intended direction, then as per the classical technical price measurement implications, testing of the levels of 1050-1085 cannot be ruled out over the coming weeks. Any close below 755 levels would negate this view.
Milan Vaishnav, CMT, MSTA
Consulting Technical Analyst
www.EquityResearch.asia | www.ChartWizard.ae