I find semiconductors to be an important group to watch, given that they essentially provide the “backbone” to our modern information economy. Pretty much every product we use at this point has a chip involved, so if chip makers are doing well, then I can assume the economy is doing just fine.
The failure of stocks like Nvidia Corp. (NVDA) to make a new high in January, while the S&P 500 did so, suggested caution and limited upside, which proved prescient. So what does it mean now that NVDA made a new low for 2022 this week?
First, let’s review how 2022 has played out for this stock, and use a “measured move” technique to identify potential downside targets.
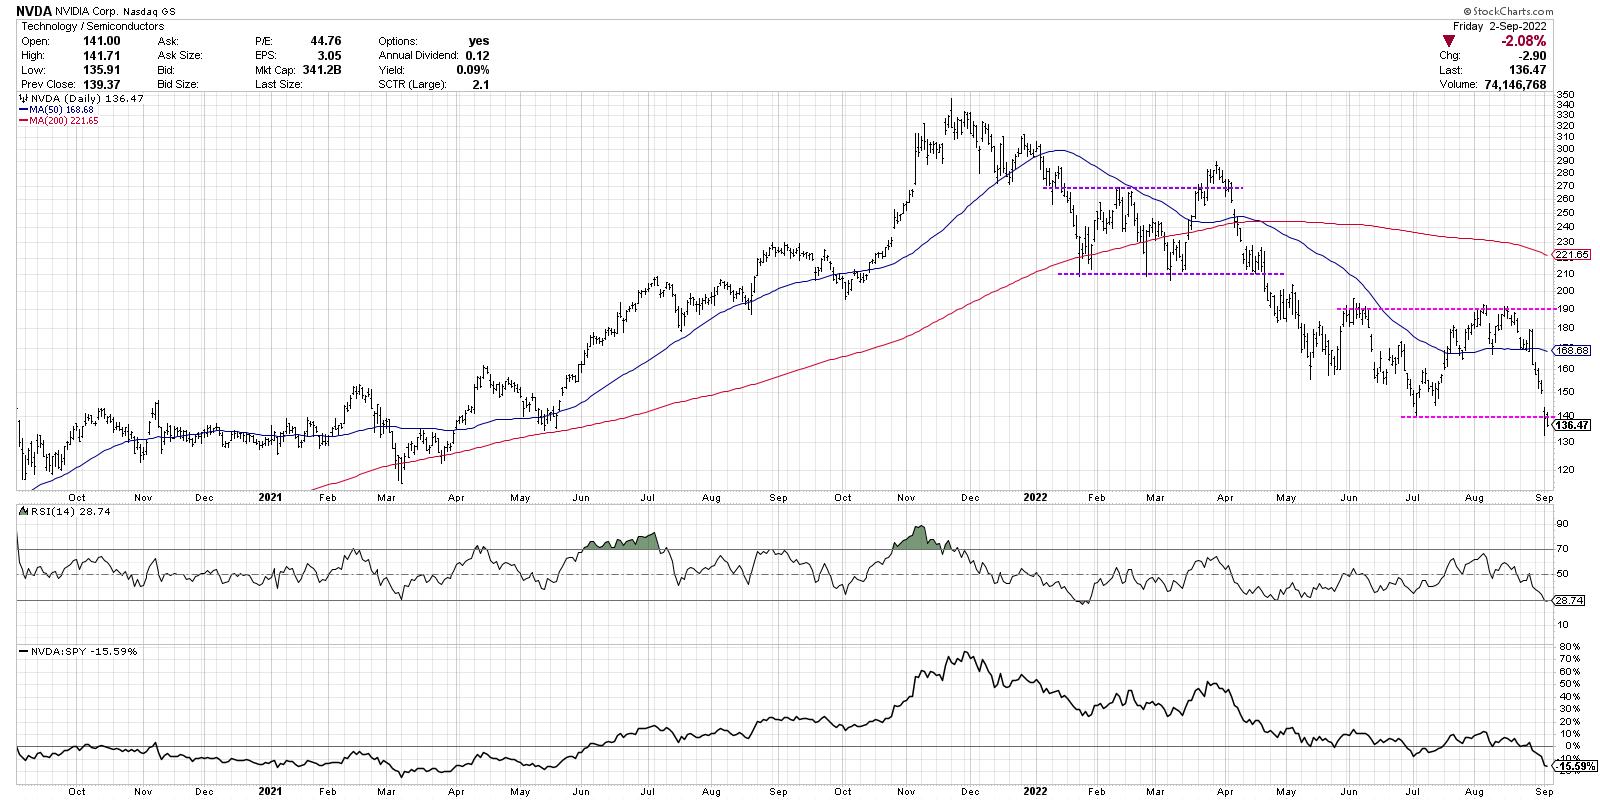
After NVDA bottomed out in January around $210, the stock spent the next three months fluctuating between 210 as support and 270-290 as resistance. This consolidation period, indicated with purple trend lines, could be called a rectangle pattern and indicates a market in equilibrium. Even though there are short-term price swings, the price was essentially rotating around a midpoint around $240. The market is basically telling you that, at this point in time, NVDA is worth about $240 a share.
In late March, the stock broke out of the pattern to the upside, but this breakout was short-lived. Just as the S&P 500 had a failed breakout above the 4600 level at this time, NVDA ended up stalling out and re-entering the consolidation area. Then in April, the price exited the pattern to the downside, confirming a new down leg in this bearish phase. Now we can use a measured move technique to anticipate a potential downside target.
What is a measured move? While there are a number of variations of this approach in the technical toolkit (even more advanced methodologies like Elliott Wave), I like to keep it simple. Basically, the trend leading into a consolidation pattern is often matched with the trend leading out of the pattern.
Let’s review the chart of NVDA and consider that first breakdown in April 2022.
If you take the initial downthrust from November 2021 to January 2022, then assume a similar trajectory after the breakdown in April, that would suggest a downside objective around $160. NVDA did indeed bounce off this level of support, which led to another consolidation phase between $140 and $190 (indicated with pink trend lines).
So what can does a similar approach tell us about the current situation for this important stock?
The move from the March swing high down to the upper end of the pattern is about a $100 move (290 to 190). We’re using log scale for this demonstration, so a similar percent move (blue arrows) would give a downside target around 90-95.
Now here’s the real question. If NVDA does reach that downside target, that would be about another 30% below current levels. What would the Nasdaq Composite do in that scenario? How about the S&P 500?
While we can run similar analysis on the major averages themselves, I have found that by some of the best tells in the market often come from analyzing specific stocks and groups, then comparing those signals to the broader indexes. In the case of Nvidia, the measured move technique suggests the bear market phase could still have plenty of room to move.
Want to digest this chart in video format? Just head over to my YouTube channel:
RR#6,
Dave
P.S. Ready to upgrade your investment process? Check out my YouTube channel!
David Keller, CMT
Chief Market Strategist
StockCharts.com
Disclaimer: This blog is for educational purposes only and should not be construed as financial advice. The ideas and strategies should never be used without first assessing your own personal and financial situation, or without consulting a financial professional.
The author does not have a position in mentioned securities at the time of publication. Any opinions expressed herein are solely those of the author, and do not in any way represent the views or opinions of any other person or entity.