


A few large-caps and large-cap techs are holding up, but other areas of the market are showing weakness. Namely, the Retail SPDR (XRT) and Regional Bank ETF (KRE) are two of the weakest groups right now. These two groups are under selling pressure and this could bode ill for the broader market. Why? Because they represent key areas of the economy.
Two Key Groups Take a Turn for the Worse
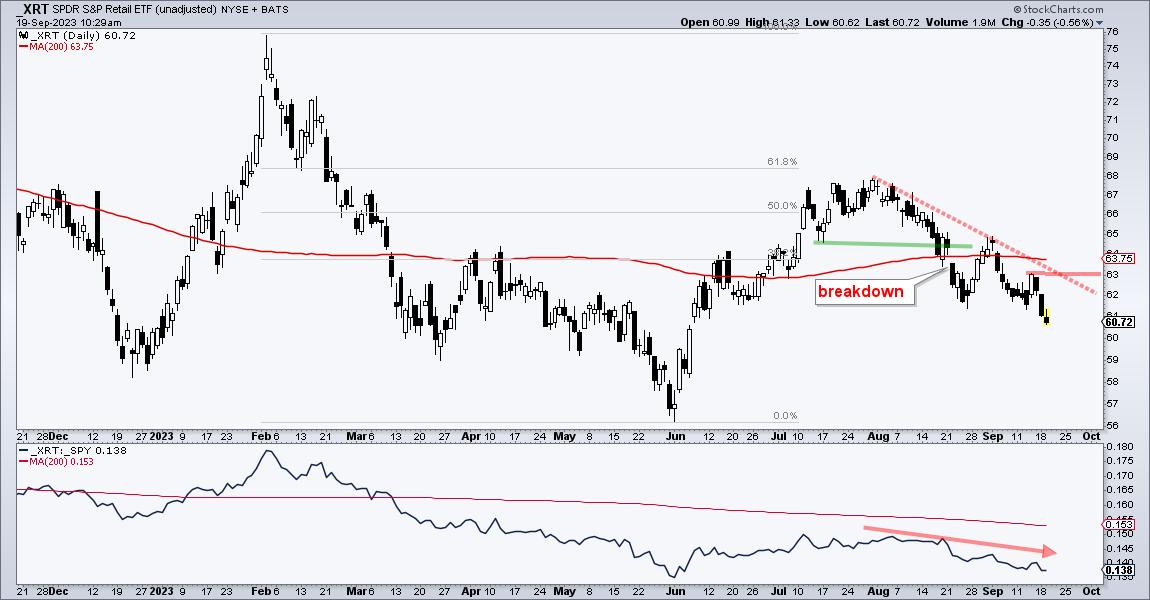
The first chart shows XRT with some classic technical analysis at work. First, the long-term trend is down because the ETF hit a 52-week low at the end of May. Second, the ETF bounced in June-July, but this bounce retraced 50-61.8% of the prior decline. A 50-61.8% retracement is normal for a counter-trend bounce. Think of it as two steps down and one step up. The bigger trend is two steps down and the 50% retracement represents one step up.
XRT broke support in mid August to reverse the counter-trend bounce. This break was noted in Chart Trader at TrendInvestorPro. The ETF continued lower into September and hit its lowest level since early June on Monday. XRT is in a clear downtrend and leading lower. The indicator window confirms relative weakness because the XRT:SPY ratio is below its falling 200-day SMA (red line). Retail spending represents around 2/3 of GDP and this chart is not a good sign for the broader market.
The next chart shows the Regional Bank ETF (KRE) with two breakdowns. First, KRE fell around 47% from February to May and then retraced around 50% with a rising channel. This is a big counter-trend bounce or a bounce within a bigger downtrend. KRE broke the channel line in mid August and this signals a continuation of the bigger downtrend.
Notice that KRE fell 14% from late July to mid August and then bounced with a rising flag. Rising flags are bearish continuation patterns that alleviate oversold conditions after a sharp decline. KRE broke flag support on September 6th and this signals a continuation of the July-August decline.
Before leaving this chart, I would like to point out the fractal nature of technical analysis. The rising channel and the rising flag are the same shapes. Both formed after sharp declines and both represent counter-trend bounces. They were also bearish continuation patterns. One pattern formed over several months and the other over several weeks. Patterns can form on any timeframe.
Check out the Chart Trader report at TrendInvestorPro objective market analysis and trading ideas. Tuesday’s report covered:
SPY and QQQ Test Breakout ZonesSPX Breadth Remains SubduedBanks, Retail and Housing Turn DownBBB Spread Has Yet to WidenTechnology SPDR and four Tech ETFsGold and the Gold Miners ETF
Click here to learn more and gain immediate access.
//////////////////////////////////////////////////


