


Trend-momentum strategies that trade stock-based ETFs should require two conditions before considering a position. First, broad market conditions should be bullish. This means being long stocks in bull markets and out of stocks in bear markets. Second, the trend for the ETF should be up. Employing these basic prerequisites can improve performance. Once these two conditions are met, we can begin the ranking process to find the strongest. Let’s look at examples with the Nasdaq 100 ETF (QQQ) and the Dow SPDR (DIA).
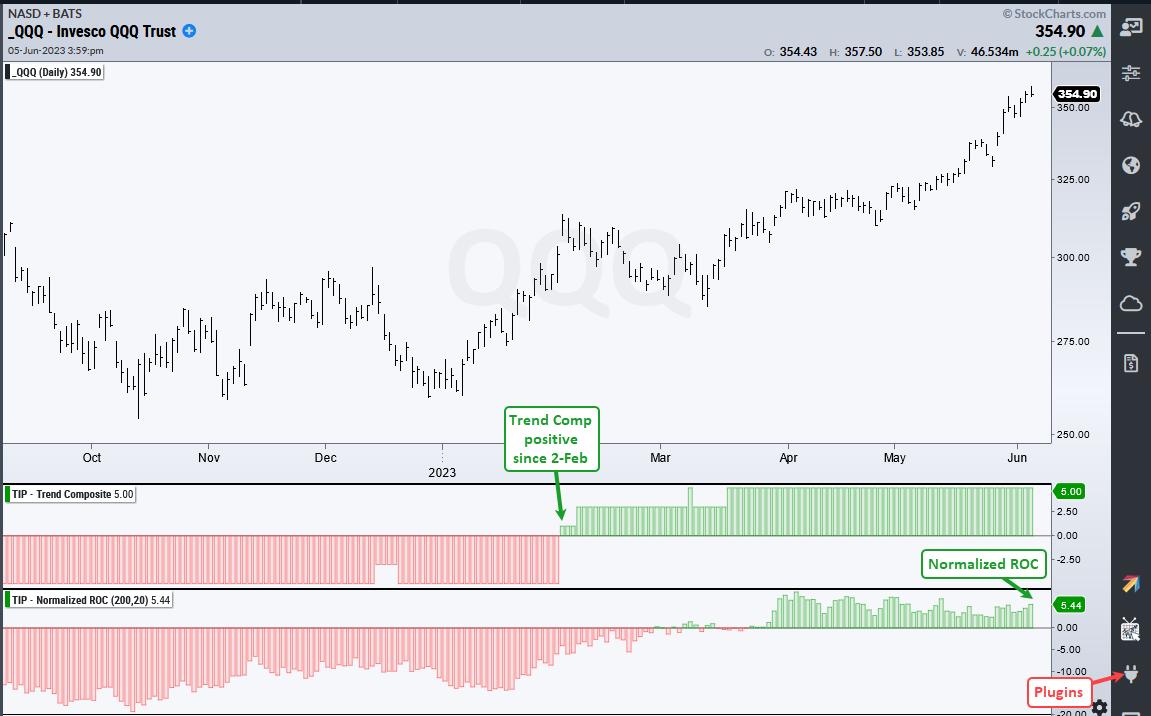
First and foremost, we must be in a bull market environment. TrendInvestorPro uses the Composite Breadth Model to determine market conditions and it has been positive since the end of March. This means the environment is favorable for stock-based ETFs. Second, the Trend Composite must be positive, which means the ETF is in an uptrend. Only ETFs in uptrends are eligible to be ranked and considered for positions in a trend-momentum portfolio. For ETFs, the rank indicator of choice is Normalized ROC. The chart below shows QQQ with a positive Trend Composite since February 2nd and Normalized ROC at 5.44.
Normalized ROC (200,20) tells us the 200-day Dollar gain or loss in ATR(20) terms. QQQ is up $26.41 the last 200 days, ATR(20) is 4.858 and Normalized ROC is 5.44 (26.41/4.858 = 5.44). In contrast to QQQ, the next chart shows DIA with a negative Normalized ROC (-1.1). Clearly, QQQ is leading and DIA is lagging. Also notice that the Trend Composite turned negative for DIA in late May. QQQ is eligible and DIA is not.
TrendInvestorPro recently introduced a strategy using Normalized ROC to trade leading ETFs. This strategy also uses the Composite Breadth Model and Trend Composite, as well as the Exponential Slope to set a momentum minimum. Subscribers get access to a seven part article detailing the strategy and showing performance metrics. Click here for immediate access.
Normalized-ROC, the Trend Composite, ATR Trailing Stop and nine other indicators are part of the TrendInvestorPro Indicator Edge Plugin for StockCharts ACP. Click here to take your analysis process to the next level.
———————————————————-


