


The fallout from the SVB (Silicon Valley Bank) collapse has finally put fear into the hearts of investors, and especially options traders, pushing up the VIX from the low 20s to a close of 26.14 on March 15, 2023. That took the VIX Index up above the prices of all of its futures contracts, which creates a unique oversold sentiment situation that is the subject of this week’s chart.
For any sentiment indicator like the VIX, analysts want to know what “high” and “low” readings consist of. Some use static numerical levels for the VIX, which is a problematic approach, as the normal levels for the VIX can vary a lot over time. Others (including me) like to use dynamic thresholds such as Bollinger Bands.
VIX Index futures contracts first started trading in March 2004, and I have found that the VIX futures market offers us a good way to benchmark what “high” or “low” VIX values are. The VIX Index is determined by the prices that traders set for S&P 500 options, and when they price in more risk premium into those options in comparison to “fair value”, it is a sign of greater fear and, thus, a bottoming condition for prices. The traders of VIX futures necessarily have to take a longer-term approach, with those contracts usually extending out as much as 8-9 months into the future, and so the prices that they set serve as a good way to see what other speculators think is a fair value for pricing in the VIX at the expiration points in the future. When the spot VIX moves too far above or below its futures contracts, it signals a big disconnect between those two camps. And it provides us with useful information.
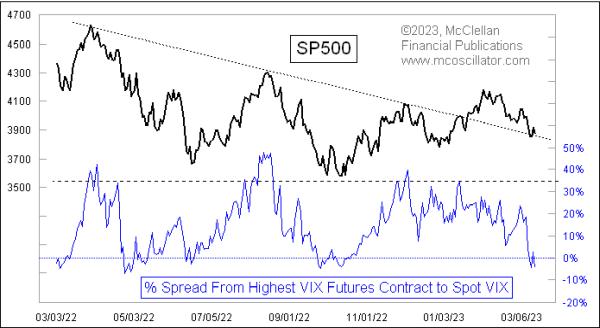
Most of the time, the VIX Index is quoted below all of its futures contracts. That is the normal state. When it goes too low below all of the VIX contracts, it shows an extreme of optimism among the options traders. In the chart above, that condition shows up as a high reading for the indicator, which measures the spread between whichever VIX futures contract has the highest price minus the VIX Index. Such a condition is a pretty good indication of a price top, although it can take a while to matter.
Right now we have the opposite condition, wherein the VIX Index is above all of its futures contracts. That produces a negative reading on this chart. Such readings do not come along very often, and they are pretty good indications of a bottoming condition for stock prices. The direct message is that the S&P 500 options traders who drive the VIX Index are feeling more fearful than the VIX futures traders believe is merited.
With any overbought or oversold reading on any indicator, it is important to realize that it represents a “condition,” and is not a “signal.” The market has no requirement to respond in the way that we think it should, just because we notice some reading on an indicator. The VIX has been higher than 27 lots of times in the past, and could very well go higher than this current reading in the days ahead. That’s possible. But the message, for now, is that the market selloff has done enough to instill a decent condition of fearfulness into the hearts of traders.


