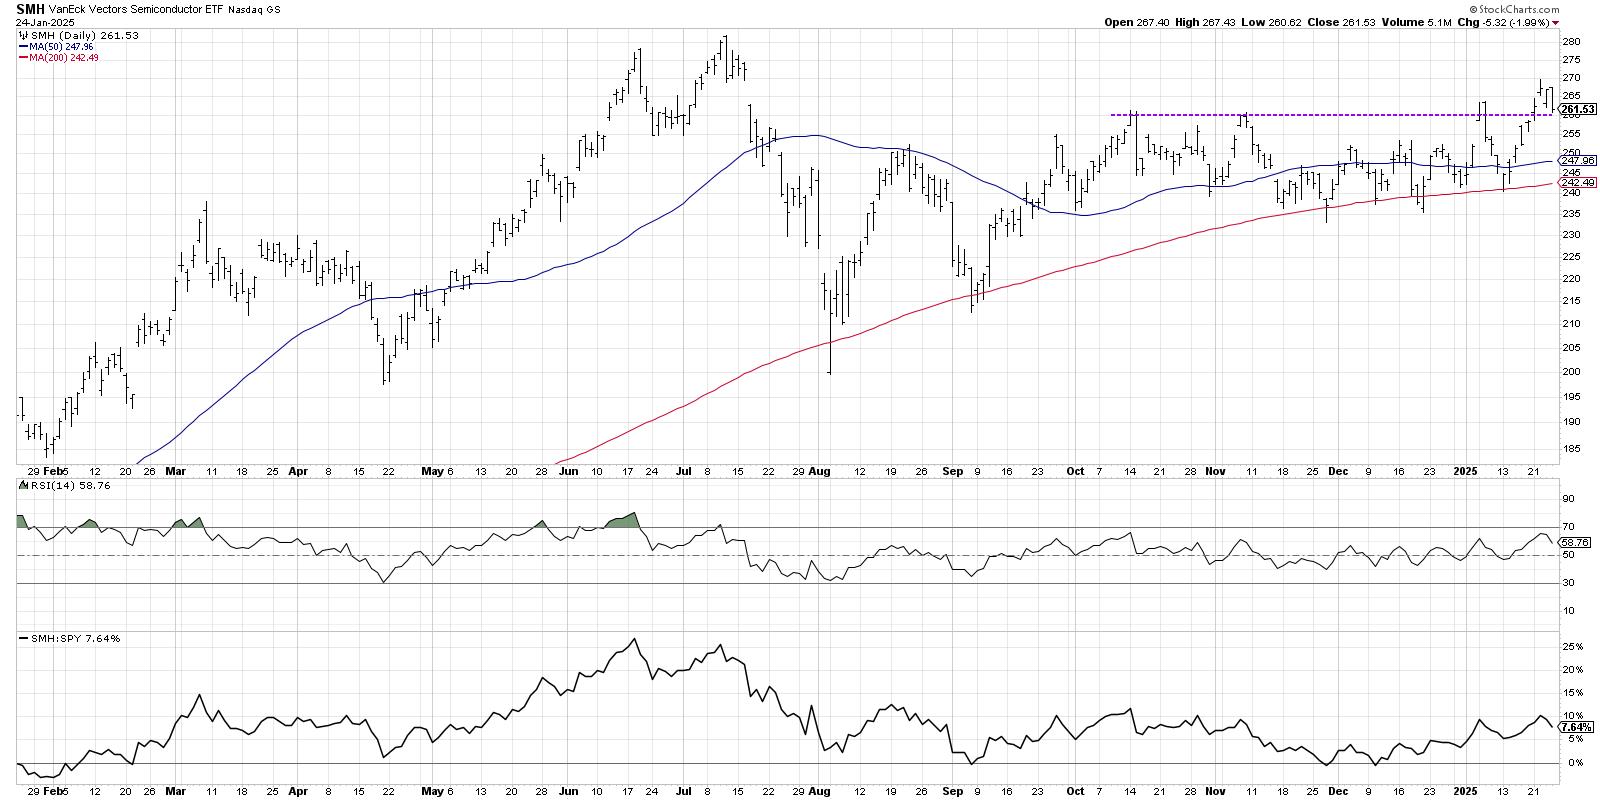
Despite the strength in some key growth stocks in January, semiconductors have been decidedly rangebound for most of the last six months. While this week’s breakout of the range appears to be a significant bullish signal, the bearish candle pattern on Friday indicates investors may be best served by being patient for upside confirmation.
Big Base Breakouts Are Bullish
After reaching a swing low around $200 in early August, the VanEck Vectors Semiconductor ETF (SMH) made a series of higher highs to reach a new peak in mid-October around $260. The SMH ended up retesting this resistance area two more times through early January, with a number of pullbacks finding support at the 200-day moving average
The failed breakout in the first week of 2025 was noteworthy in that it was punctuated by a bearish engulfing pattern, representing short-term distribution according to candlestick chart aficionados. Tuesday of this week, we saw another breakout above the $260 level, and an upside follow-through day suggested that this breakout may finally have staying power.
What is the first market-related thing you look at every morning? If the answer is “financial television” or “my brokerage account” then we have some work to do! In his upcoming FREE webcast on Wednesday, January 29th, Dave will share the actual morning coffee routine that he uses every morning to clearly define market trends, identify shifts in investor sentiment, and check in on market action.
You’ll leave this session with plenty of ideas on how to upgrade your own daily market analysis routine to improve your market awareness. Sign up for this free event HERE and learn how better routines lead to better decisions!
Semis Have Finally Closed the Gap
While this week’s breakout did confirm a breakout above the recent consolidation pattern, a closer look reveals that SMH may have just simply closed the price gap from July 2025.
I often get asked about how I use price gaps in my analysis, and my general answer is that I treat them as support and resistance zones. I’ve found that the market has memory, and investors tend to gravitate toward price gaps as meaningful levels of interest, considered a “pivot point” for future potential reversals.
So while the move above $260 appears to be a good breakout, the fact that we’re still in the price gap from last summer suggests that perhaps there is still more to prove before we can sound an “all clear” for semiconductors.
Bearish Engulfing Pattern Suggests Another Peak
Candle charts can be so helpful in understanding the short-term sentiment shifts within the context of the longer-term market trends. And Thursday and Friday brought us the dreaded bearish engulfing pattern, a two-candle reversal pattern that suggests a bearish shift in short-term sentiment.
What’s so fascinating about SMH is that we had another bearish engulfing pattern on the previous test of $260 from earlier in January, resulting in a pullback to the 200-day moving average. If you look closely at the first chart we shared in this article, you may notice bearish engulfing patterns at a number of price peaks over the last 12 months!
While the bearish engulfing pattern doesn’t necessarily negate the recent “big base breakout”, it does suggest that semis have lost some upside momentum. I look for breakouts with improving momentum, improving volume, and improving price action. Unfortunately for semiconductors, it looks like investors may have to watch for more confirmation before believing in this latest attempt to find a new high!
RR#6,
Dave
PS- Ready to upgrade your investment process? Check out my free behavioral investing course!
David Keller, CMT
President and Chief Strategist
Sierra Alpha Research LLC
Disclaimer: This blog is for educational purposes only and should not be construed as financial advice. The ideas and strategies should never be used without first assessing your own personal and financial situation, or without consulting a financial professional.
The author does not have a position in mentioned securities at the time of publication. Any opinions expressed herein are solely those of the author and do not in any way represent the views or opinions of any other person or entity.


