


The week that went by was in complete contrast to the week before as the markets heavily consolidated in a tight range. In the week before this one, the Nifty had seen a significant retracement of over 1167 points; however, over the past five trading days, the index stayed totally devoid of any directional bias and ended the week on a flat note. The volatility also tapered down; the India VIX came off by 6.42% to 13.22 on a weekly basis. The trading range also got much narrower; the index oscillated in a range of 539.70 points. Following some strong consolidation, the headline index closed flat with a minor weekly loss of 50.35 points (-0.20%).
The coming weeks are crucial for the markets from a short-term perspective. The NIFTY Bank and FINNIFTY will cease to have weekly contracts beginning November 20 following the SEBI’s recent directives. It will be only NIFTY that shall have weekly contracts. This may keep the indices a bit volatile over the coming days. Importantly, the Nifty’s behavior against the 25000-25050 zone is important as the 25050 is where the 50-DMA is, and the 25000 level remains a psychologically important level. The markets were anyway highly deviated from the mean. The nearest 20-week MA stands at 24541; the Nifty has not even tested this level during the recent retracement. Even if that is tested, the primary uptrend would still remain very much intact.
The coming week may see a tepid start; the levels of 25100 and 25365 shall act as probable resistance points. The supports coming in lower at 24800 and 24540 levels.
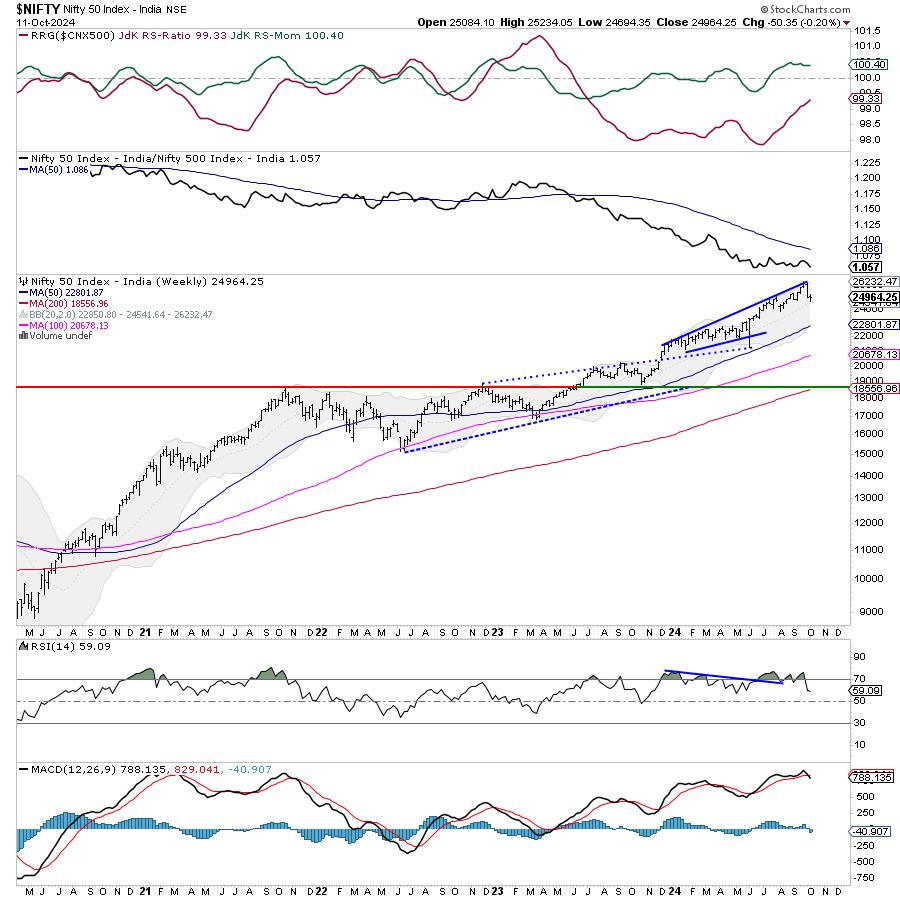
The weekly RSI stands at 59.09; it remains neutral and does not show any divergence against the price. The weekly MACD has shown a negative crossover; it now trades below its signal line.
The pattern analysis shows that the week’s low point of 24694 found support at the extended rising trendline. This trendline was drawn from the level of 22124 and it extends itself joining the subsequent high points. It is important to note that this low point coincides with the 20-week MA; the fastest and the nearest weekly MA which stands at 24541. This makes the zone of 21540-21700 a very important pattern support zone for the Nifty.
All in all, we have a lot of short positions as reflected by the derivatives data. Speaking specifically for the coming week, Nifty’s behavior vis-à-vis the level of 25000-25050 would be crucial to watch. On the other hand, the strikes of 25000 hold a co-existence of the highest Call and Put OI; this makes this level almost an inflection point for the Index. For the Nifty to extend its technical pullback that it attempted in the previous week, it must move past and keep its head above the 25000-25050 zone. It is strongly recommended that we stay invested in stocks that show strong relative strength; this would ensure resilience if the markets do not move in our intended direction. A cautious approach is recommended for the coming week.
Sector Analysis for the coming week
In our look at Relative Rotation Graphs®, we compared various sectors against CNX500 (NIFTY 500 Index), which represents over 95% of the free float market cap of all the stocks listed.
Relative Rotation Graphs (RRG) show Nifty Pharma, Services Sector, IT, Consumption, and FMCG indices inside the leading quadrant. Although the FMCG index is showing a decline in its relative momentum, these groups are by and large likely to relatively outperform the broader markets.
Nifty Midcap 100 and Auto Index are inside the weakening quadrant. They may, however, continue to show stock-specific performance while relative performance may keep slowing down.
The PSE, Infrastructure, Realty, Metal, Nifty Bank, PSU Bank, Energy, Commodities, and Financial Services indices are inside the weakening quadrant. However, except for Commodities, Energy, and PSE indices, the rest are seen sharply improving on their relative momentum.
The Nifty Media index is the only index inside the Improving quadrant. However, it is seen giving up its relative momentum as well against the broader markets.
Important Note: RRG™ charts show the relative strength and momentum of a group of stocks. In the above Chart, they show relative performance against NIFTY500 Index (Broader Markets) and should not be used directly as buy or sell signals.
Milan Vaishnav, CMT, MSTA
Consulting Technical Analyst
www.EquityResearch.asia | www.ChartWizard.ae


