


The equity markets consolidated throughout the week. While staying in a narrow range and trading sideways for almost all days of the week, the Indices stayed devoid of any directional trend. Following strong weekly gains of over 1.58% in the week before this one, the NIFTY chose to remain in a defined range; the trading range got narrower and the Nifty oscillated in the 204.65 points range while defending the most immediate support of the 20-week MA. The benchmark index closed with net weekly gains of just 62.90 points (+0.32%).
Although some intraday spikes of volatility were observed, IndiaVIX declined by 4.21% to 11.33 on a weekly basis. While no major technical event/development took place over the past five sessions, the point of focus remains the 20-week MA which is acting as the most immediate short-term support for the Nifty. This 20-week MA is placed at 19570; so long as the Index can keep its head above this point on a closing basis, it will continue to consolidate. However, any violation of this WMA on a closing basis will invite incremental weakness for the markets. This makes the 19500-19570 the most immediate and important support zone for the Nifty.
We have a long weekend this time with Monday, 27th November being a trading holiday on account of Guru Nanak Jayanti. The coming week also has a monthly derivatives expiry lined up as well. Tuesday will see the Markets starting by adjusting themselves to the global trade setup. The levels of 19900 and 20030 are likely to act as potential resistance levels. The supports are expected to come in at 19610 and 19480 levels.
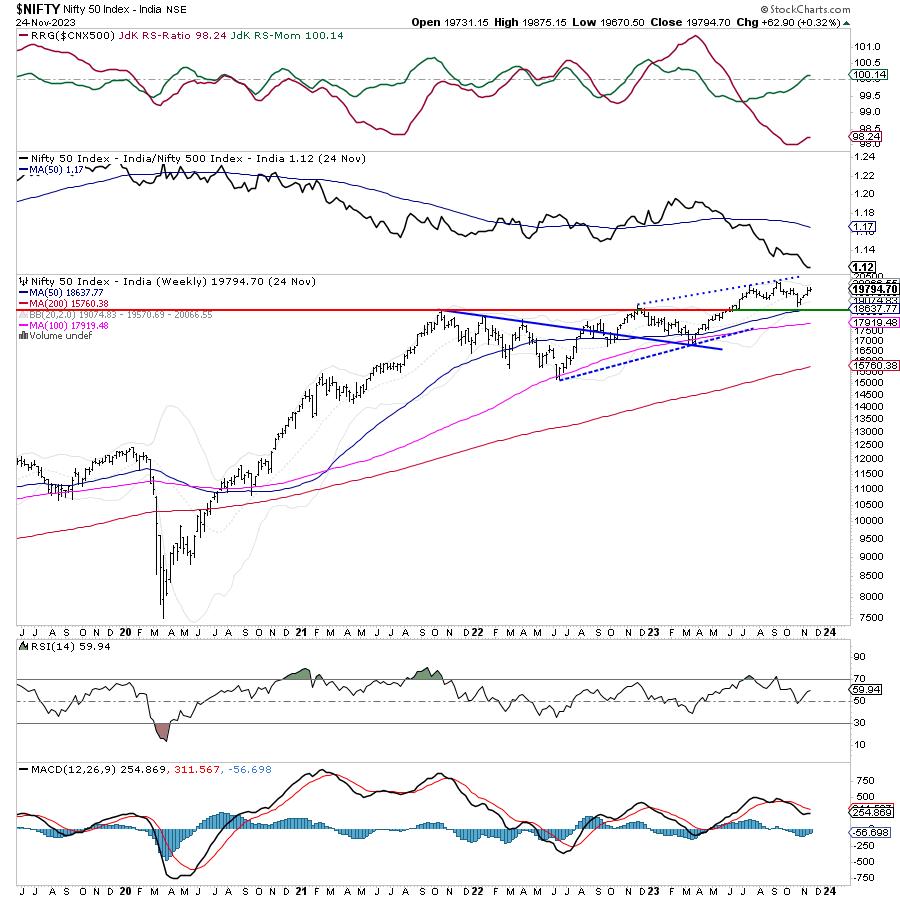
The weekly RSI is 59.94; it continues to stay neutral while not showing any divergence against the price. The weekly MACD stays bearish and remains below its signal line. No major formations on the candles were seen.
The pattern analysis of Nifty on the weekly charts shows that the Index continues to inch higher while staying inside a rising channel. Having said this, in the previous week, the index has formed a similar top and higher bottom on the charts. This makes the level of 19875 one of the pattern resistance levels. Overall, the zone of 19850-19900 remains an important resistance zone; unless this zone is taken out, the Nifty is likely to stay in a defined range and consolidate. The most immediate support on a closing basis is at 20-week MA which is presently placed at 19570.69.
All in all, over the coming truncated week, the markets may continue to stay in a broadly defined range while staying devoid of any major directional bias. A sustainable trend will emerge only after the Nifty takes out the 18900 levels comprehensively or violates 19500-19550 on a closing basis. Unless either of these levels is taken out on the upside or violated on the downside, we will continue seeing Nifty in a trading range. It would be prudent to protect profits at higher levels while investing in stocks that are relatively stronger or have improving relative strength. A selective approach is advised over the coming week.
Sector Analysis for the coming week
In our look at Relative Rotation Graphs®, we compared various sectors against CNX500 (NIFTY 500 Index), which represents over 95% of the free float market cap of all the stocks listed.
Relative Rotation Graphs (RRG) do not show any major change in the sectoral setup as compared to the previous week. The Nifty Energy, Commodities, Realty, PSE, PSUBank, and Infrastructure indices are inside the leading quadrant. These pockets are expected to continue to outperform the broader NIFTY 500 Index relatively.
The NIFTY IT Index has rolled inside the weakening quadrant of the RRG. Besides this, the Auto, Media, Midcap 100, Pharma, and Metal indices are also inside the weakening quadrant. However, Auto and Pharma indices continue to show improvement in their relative momentum.
NiftyBank is the only index inside the lagging quadrant. However, that is also showing signs of improvement in its relative momentum against the broader markets.
Nifty Services sector, Financial Services, FMCG, and Consumption Indices are inside the improving quadrant. The FMCG and the Consumption space look better placed to improve its relative performance against the broader markets.
Important Note: RRG™ charts show the relative strength and momentum of a group of stocks. In the above Chart, they show relative performance against NIFTY500 Index (Broader Markets) and should not be used directly as buy or sell signals.
Milan Vaishnav, CMT, MSTA
Consulting Technical Analyst
www.EquityResearch.asia | www.ChartWizard.ae


