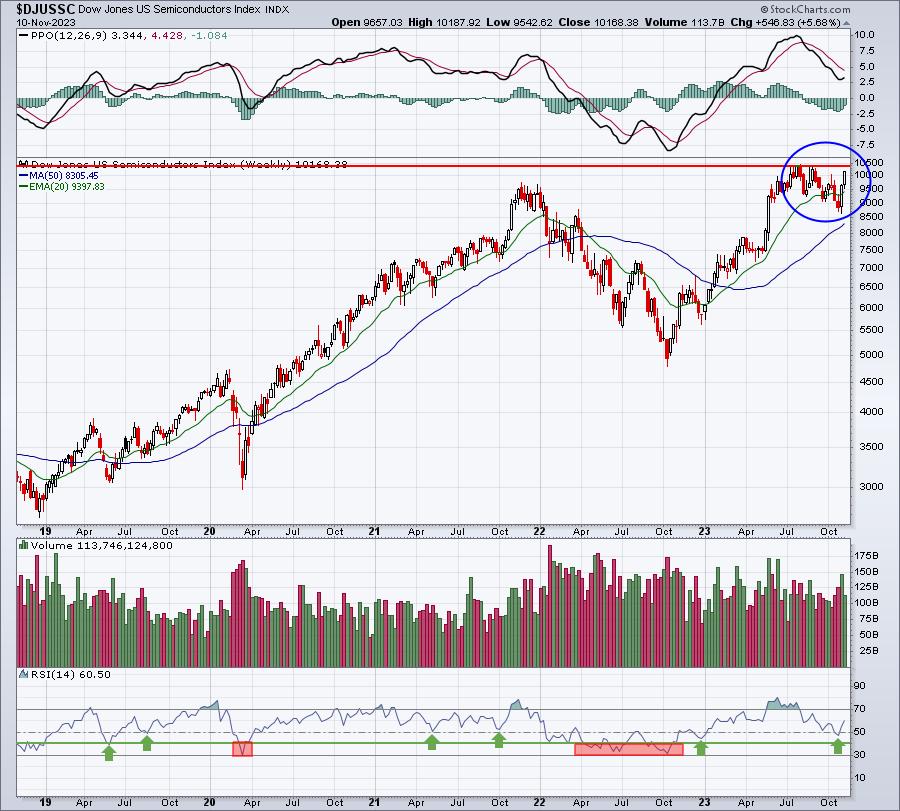
It was another very solid day on Friday, this time with the S&P 500 powering above 4400 and the NASDAQ 100 busting back above 15500, both clearing key price resistance levels that effectively end the series of lower highs and lower lows from the July high. The best news of all is that growth continues to be the driver behind market strength. On Friday, the Dow Jones U.S. Semiconductor Index ($DJUSSC) jumped another 3.7%, rapidly approaching the July and all-time high of 10430. The DJUSSC needs only another 2.6% gain to break to yet another all-time high:
Notice that the RSI has now moved back through 60, showing more bull market readings and behavior. The green arrows mark RSI support in the 40-50 range during secular bull market advances. The two bear markets, one in 2020 and the other in 2022, saw the RSI fall well below 40. The behavior in the RSI right now is absolutely bullish.
I do a TON of research during earnings season, highlighting key earnings gaps where we tend to see successful tests and reversals. While we’ve seen several nice gaps higher in semiconductors, here are two outside that group that occurred recently:
DASH
DoorDash, Inc. (DASH) recently reported the following revenues and EPS:
Revenues: $2.16 billion (actual) vs. $2.09 billion (estimate)EPS: -$0.19 (actual) vs. -$0.45 (estimate)
After blowing away estimates, DASH gapped up 12% from 75.90 to 85.09. After reaching an intraday high of 93.19 the next day, DASH fell back and tested the top of gap support at 85.09 on Thursday. On Friday, DASH jumped off of gap support to the tune of 3.48%. While a drop to the rising 20-day EMA is certainly a possibility, I believe we’ll see DASH breaking out above 93 in the not-too-distant future:
The internet group ($DJUSNS) has been another very bright industry group, easily outperforming the benchmark S&P 500 throughout 2023. So DASH is not only a stock that crushed revenue and EPS expectations, but it hails from one of the best industry groups of 2023.
DASH hasn’t had a long history as a public company, but it has performed well in November as you can see from the seasonality chart below:
The average November gain is at 14.1%, which is higher than any other month of the year. Again, there’s not a lot of history to go on here, but DASH does at least show a tendency to move higher this time of year. December hasn’t been all that bullish, but January is the 2nd best month of the year for DASH. I like to see earnings-related technical breakouts line up with seasonal tailwinds. DASH does exactly that.
If you haven’t already taken me up on my offer to download my Bowley Trend seasonality PDF, please do so. Learn the long-term historical tendencies so that you can better time your trades. There’s one period – the same days – every month that represents roughly 1/3 of the calendar month, but have produced more than 80% of the S&P 500 gains. If you’re not taking advantage of this historical pattern, it’ll be much more difficult to beat the S&P 500. You can CLICK HERE to download your FREE COPY of my Bowley Trends PDF to better understand history and to improve your trading results. By signing up, you’ll also receive my EB Digest newsletter on Monday that features a stock likely to surge higher into its earnings report in December. Be sure to check it out, along with the PDF!
Happy trading!
Tom


