


Which Cyber Security ETF is the StrongestStocks were hit hard the last two weeks with the S&P 500 SPDR (SPY) breaking below its August low. SPY also forged a lower high from July to August. Stocks and ETFs that held above their August lows are showing relative strength. With that in mind, the three cyber security ETFs stand out and one is stronger than the others. This standout and two cybersecurity stocks were featured in Thursday’s Chart Trader Report & Video.
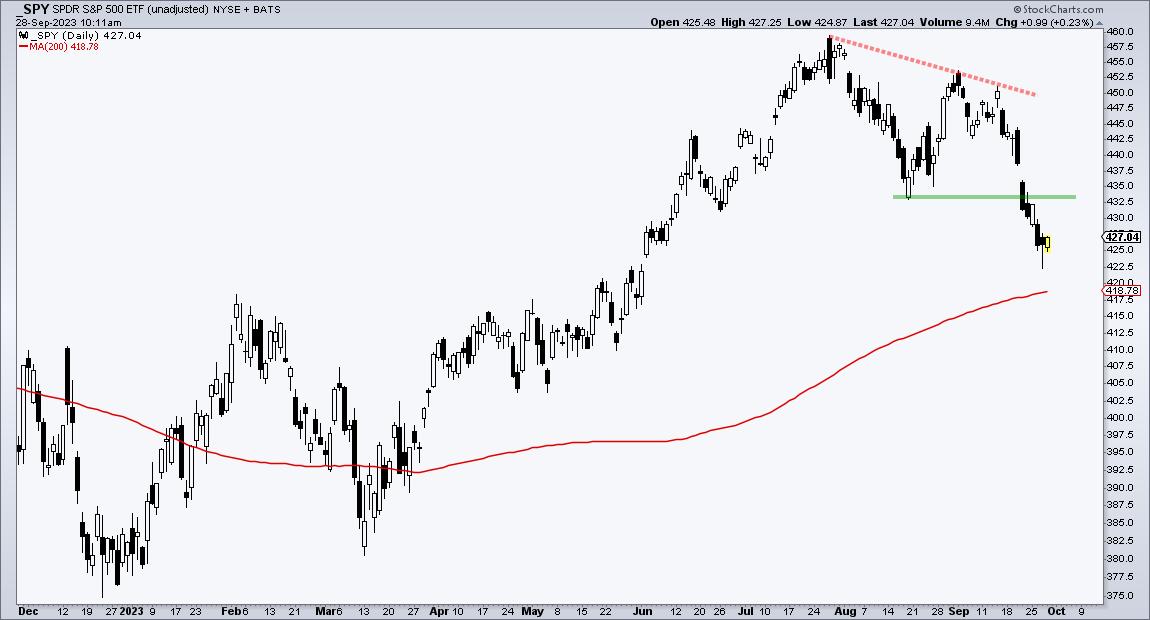
The first chart shows SPY to set the reference points. First, SPY formed a lower high from July to early September (red dashed lines). Second, SPY broke the August low with a sharp decline (green line). These are the two reference points to keep in mind going forward.
The next chart shows the Cybersecurity ETF (CIBR). First, notice that it formed two equal highs in the 47.50 area (red dashed line). CIBR did not forge a lower high and showed more strength. Second, CIBR held above the August low during the September decline. Again, CIBR is holding up better and showing relative strength.
The next chart shows the Cybersecurity ETF (BUG) with the same characteristics.
The next chart shows the Cyber Security ETF (HACK) with different characteristics. HACK forged a higher high and a 52-week high on September 1st. This higher high means it was stronger than SPY on the way up. HACK fell with the rest of the market over the last two weeks, but remains well above the August low. HACK shows relative strength on this decline.
The chart above also shows a bullish continuation pattern in play. This pattern is explained in the video above. Note that I featured HACK and two cybersecurity stocks in the Chart Trader Report & Video on Thursday morning. This report also showed three short-term breadth indicators becoming oversold the last two days. Click here to learn more and gain immediate access.
The TIP Indicator Edge Plug-in for StockCharts ACP has 11 indicators to enhance your analysis and trading. These include the Trend Composite, Momentum Composite and ATR Trailing Stop. Click here to learn more and take your trading to the next level.
—————————————


