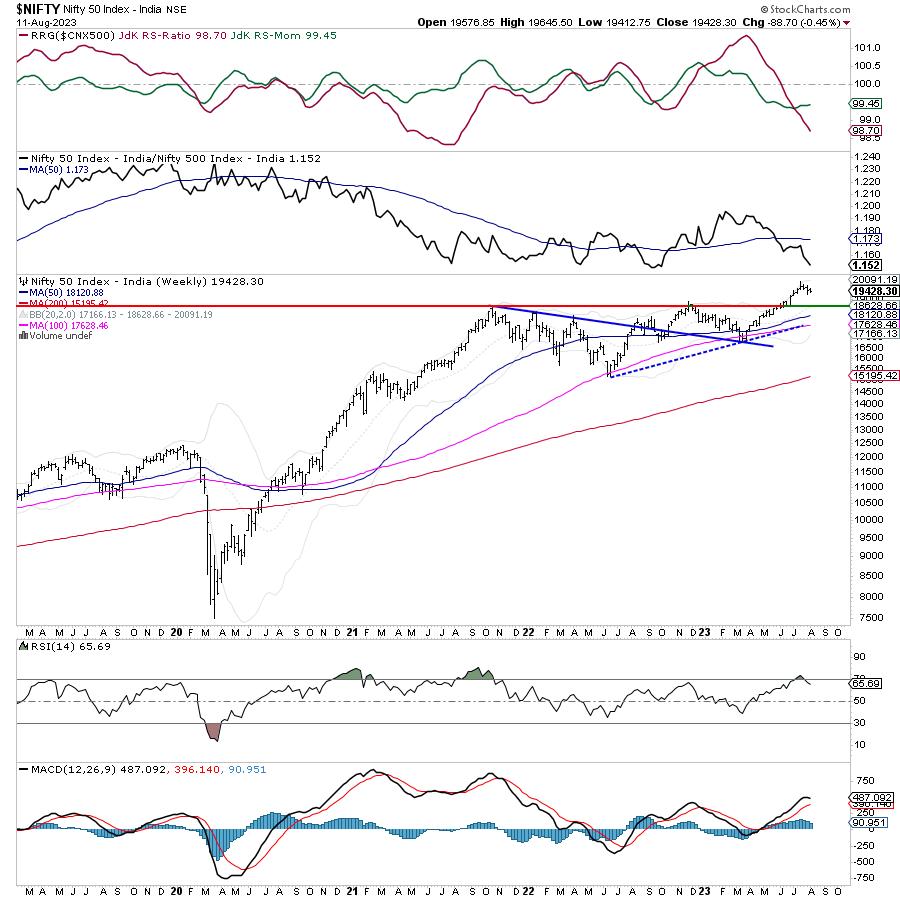
In line with what was anticipated in the previous weekly technical note, the Indian equity markets witnessed profit-taking bouts from higher levels along with spikes in the volatility that is hovering around one of its lowest levels of recent months. It was also expected that the current uptrend might stand disrupted and the markets may slip under corrective consolidation. The trading range again got narrower; against 499 points in the week before this one, the NIFTY oscillated in a 232.75 points range. Though the directional bias on either side was not dominant, the overall move stayed with an inherently negative bias. The headline index closed with a net loss of 88.70 points (-0.45%) on a weekly basis.
Despite slow retracements from the high point, from a technical perspective, the levels of 19991 have now become a temporary top for the markets. The VIX also spiked; despite the on-and-off nature of the move, the volatility as represented by INDIAVIX surged by 8.99% to 11.52. Despite the surge, it remains at one of the lowest levels seen in recent months and continues to leave the market vulnerable to corrective moves and violent profit-taking bouts from higher levels. Following this corrective move, the NIFTY has dragged its resistance lower to 19700-19750 levels; any technical pullbacks will find resistance in this zone.
We have a truncated week coming up with August 15th will be a trading holiday on account of Independence Day. The markets are likely to start the week on a quiet note and exhibit tentative behavior throughout the week. The levels of 19580 and 19650 are likely to act as potential resistance points; the supports will come in at 19350 and 19200 levels.
The weekly RSI is 65.69; it stays neutral and does not show any divergence against the price. The weekly MACD is bullish and remains above the signal line. An inside bar occurred; the current bar has a lower high and a higher low as compared to the previous bar.
Going by the pattern analysis and looking from a short-term perspective, a directional move should occur above 19750 or below 19300 levels. Until either of these levels is taken out, expect the markets to continue to consolidate in a defined range.
All and all, some risk-off sentiment is likely to prevail in the markets. The traditionally defensive pockets like Pharma, Consumption, IT, PSE, etc., are likely to display resilient performance. It is strongly recommended to avoid aggressive exposures and stay extremely stock-specific while approaching the markets. While keeping leveraged positions at modest levels, a cautious and selective approach is advised for the coming week.
Sector Analysis for the coming week
In our look at Relative Rotation Graphs®, we compared various sectors against CNX500 (NIFTY 500 Index), which represents over 95% of the free float market cap of all the stocks listed.
The analysis of Relative Rotation Graphs (RRG) shows that Infrastructure Index and PSU Bank Index have rolled inside the leading quadrant. Besides this, the Midcap 100, Realty, and Pharma indices are also placed inside the leading quadrant. These groups are likely to relatively outperform the broader NIFTY500 Index.
NIFTY Auto, Consumption, and FMCG indices are inside the weakening quadrant. The PSE Index is also inside the weakening quadrant but it is seen improving on its relative momentum.
Nifty Financial Services and Nifty Bank index are seen languishing inside the lagging quadrant. The commodity, IT, and Services sector indices are also inside the lagging quadrant but they appear to be improving on their relative momentum against the broader markets.
The Media, Metal, and Energy indices are inside the improving quadrant; they are seen rotating favorably in the northeast direction and may continue to better their relative performance against the broader markets.
Important Note: RRG™ charts show the relative strength and momentum of a group of stocks. In the above Chart, they show relative performance against NIFTY500 Index (Broader Markets) and should not be used directly as buy or sell signals.
Milan Vaishnav, CMT, MSTA
Consulting Technical Analyst
www.EquityResearch.asia | www.ChartWizard.ae


