


The weight of the evidence remains strong for stocks, but this is not a bull market that lifts all boats. It is a relatively selective bull market led by technology, housing and a few other groups. This is not necessarily bad. It is, however, important to separate the leaders from the laggards. Today’s commentary will show a chart example using Normalized ROC to rank and a table of the ETF leaders.
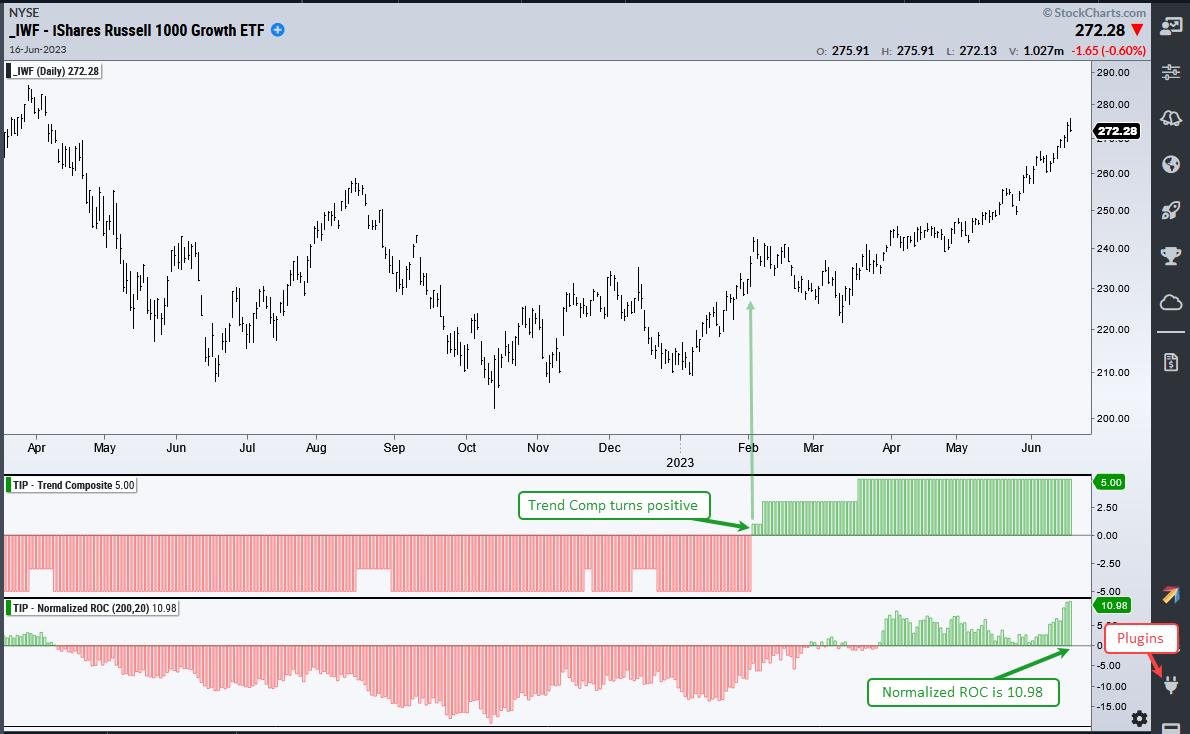
The chart below shows the Russell 1000 Growth ETF (IWF) with the Trend Composite and Normalized ROC (200,20). The Trend Composite aggregates trend signals in five trend-following indicators. It turned bullish in late January (green) and has been at +5 since mid March, which means all five indicators are bullish. This is a clear uptrend.
The bottom window shows Normalized ROC (200,20), which is the 200-day point change divided by ATR(20). This shows the 200 day advance in ATR terms and IWF is up around 11 ATR(20) values the last 200-days (10.98).
We can use Normalized ROC values to rank performance for ETFs and build a trading strategy. The image below comes from a signal and rank table for a Trend-Momentum strategy at TrendInvestorPro. This strategy trades 74 stock-based ETFs. An ETF is eligible for trading when the Composite Breadth Model is positive (bull market) and the ETF’s 120-day Exponential Slope (eSlope) is above 10 (uptrend). Only 16 of the 74 ETFs are eligible (21.62%) (green shading).
Even though 21.62% is a relatively small percentage for a bull market, it shows us the leading ETFs and there are still plenty to choose from. Leading groups include, housing (ITB), several tech-related ETFs (blue shading), gold miners, two growth ETFs and an ESG ETF (SUSA). Chartists looking to capture upside leadership and momentum can focus on these ETFs.
Check out TrendInvestorPro if you would like to learn more about this ETF strategy. We also have an All-Weather strategy and a Mean-Reversion strategy for ETFs. This month we are developing a rotation strategy that trades stocks in the Nasdaq 100 and S&P 500. Click here for immediate access.
Normalized-ROC, the Trend Composite, ATR Trailing Stop and nine other indicators are part of the TrendInvestorPro Indicator Edge Plugin for StockCharts ACP. Click here to take your analysis process to the next level.
—————————————


