


SPX Monitoring Purposes: Long SPX on 2/6/23 at 4110.98.
Monitoring Purposes GOLD: Long GDX on 10/9/20 at 40.78.
Long-Term SPX Monitor Purposes: Neutral.
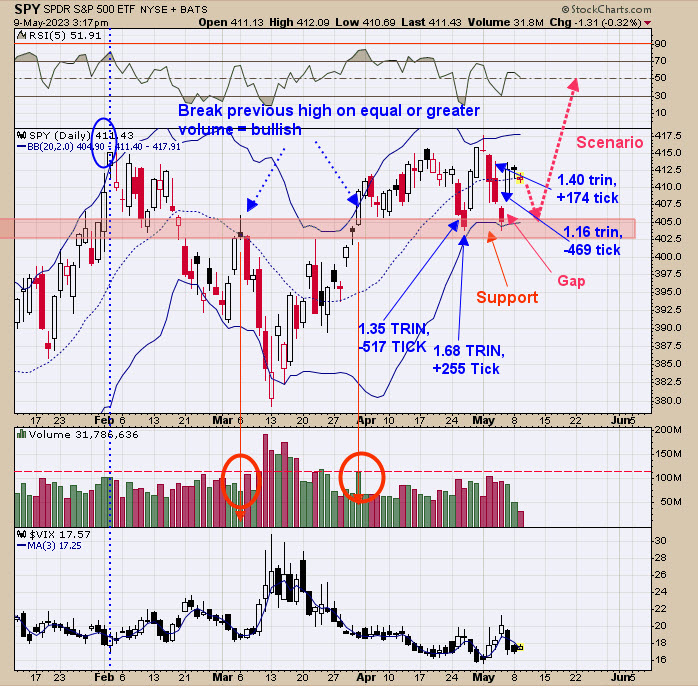
What we said yesterday still stands. “We noted the bullish TICK and TRIN closes (noted in blue) on April 25 and 26 and May 2 and 3 which come at the 405 to 410 SPY range. TICK closing readings below -200 and TRIN closes above 1.20 suggests there is panic in the market, and panic forms near lows. There is an open gap from last Friday near 405 SPY, which is also the previous high of early March and a support area (shaded area in pink). We have panic in the TICK and TRIN on the previous and current pullback, and panic forms near lows in the market. Panic is present near the 405 SPY area, which in turns suggests support. The SPY again may attempt to test the gap near the 405 level before heading higher. The intermediate-term trend appears up, and the short-term trend could attempt to fill gap near 405 before heading higher.”
Above is an indicator that helps to find the larger trend. The bottom window is the 5-week average of the SPX/VIX ratio. This ratio rises and falls with the SPX. Tops in SPX can occur when the SPX makes higher highs and the SPX/VIX ratio makes lower highs. We pointed out past tops in the SPX when this condition arises. The 5-period SPX/VIX ratio has made a higher high while SPX is testing its previous high, which we take as a bullish divergence and that SPX will made a higher high soon. The market appears to be building a base for a rally higher. Possible upside target is the January 2022 high near 4700 SPX.
We have been looking at the 50-day average of the Up Down Volume percent for GDX and the 50-day average of the Advance/Decline percent for GDX over the last several days; both of which are above 0 and bullish. The bottom window in the chart above is the 18-day average of the Advance/Decline percent for GDX and the next window higher is the 18-day average of the Up Down Volume percent for GDX. We have shown these charts in the past; these two indictors help find surges patterns in GDX. When both indicators reach +40 and higher, GDX enters into what we call a “surge pattern” where GDX strongly rallies, and the rally lasts from 3 to 6 months (mostly in the 4 to 5 months). Both indicators reached above +40 on April 4. Add four to five months to April 4 and the rally could extend into August to September of this year. We have another indicator, which we will show in a future report, that a 100% rise from the October low is possible, which would give a target on GDX near 44.00.
Tim Ord,
Editor
www.ord-oracle.com. Book release “The Secret Science of Price and Volume” by Timothy Ord, buy at www.Amazon.com.
Signals are provided as general information only and are not investment recommendations. You are responsible for your own investment decisions. Past performance does not guarantee future performance. Opinions are based on historical research and data believed reliable; there is no guarantee results will be profitable. Not responsible for errors or omissions. I may invest in the vehicles mentioned above.


