


SPX Monitoring Purposes: Long SPX on 2/6/23 at 4110.98.
Monitoring Purposes GOLD: Long GDX on 10/9/20 at 40.78.
Long Term SPX Monitor Purposes: Neutral.
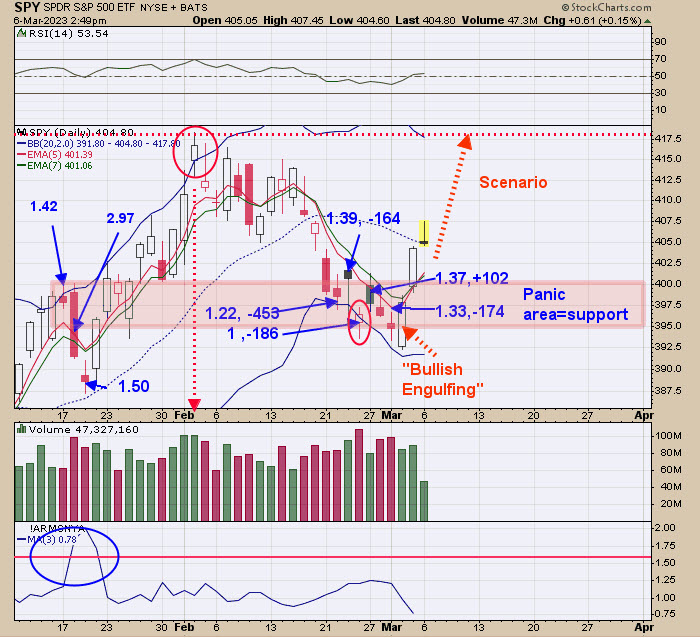
The tan-shaded area is where panic in the TRIN and TICK occurred and panic from near lows, so the 395 to 400 range on the SPY is a support area. The blue numbers are TRIN closes (first number), followed by TICK closes (second number). For the very short term, SPY could back and fill near the tan area before heading higher. The short-term statistics are not showing a bullish or bearish sign, but the monthly chart leans bullish (page two). At some point, probably this month, a “Sign of Strength” may show up near the 405 (close to where the SPY is now) and rally, through the monthly Neckline on wide price spread along with higher volume (Sign of Strength). One noteworthy statistic; since 1950, pre-election years (like this year) are 17-1 for an average annual gain of 16.8%.
Above is the SPY monthly chart. The pattern that appears to be forming is a “Head-and-Shoulders Bottom” where the Head is the October low, the Right Shoulder is forming now, and the Neckline lies near the 405 level. SPY has tested the 405 level five times over the last five months. The more times a level is tested, the more likely that level will be exceeded. There is symmetry in Head-and-Shoulders patterns. Notice how, below the Neckline starting May of last year, the market declined for five months into the October low. From the October low, SPY rose for five months, showing symmetry. Currently, SPY is at the Neckline and will need a “Sign of Strength” through this level to confirm the Head-and-Shoulders pattern. This potential pattern has a measured target to the 470 level, which is the previous major high.
The middle window is the weekly XAU/Gold ratio and the next higher window is the RSI of this ratio. Intermediate-term lows in the XAU are found when the weekly RSI for the weekly XAU/Gold ratio falls below 30, then turns up. The chart above goes back to mid-2013. The blue lines show the times when the weekly RSI fell below 30, which triggered the buy signals. Starting in 2015, most buy signals lasted a year on this type of indictor. That would give a target for July of this year on the current signal. The XAU has moved sideways since mid-2020 and is due to do something different. Our view right now (which may change) is a breakout above the 150 range, producing an impulse wave higher.
Tim Ord,
Editor
www.ord-oracle.com. Book release “The Secret Science of Price and Volume” by Timothy Ord, buy at www.Amazon.com.
Signals are provided as general information only and are not investment recommendations. You are responsible for your own investment decisions. Past performance does not guarantee future performance. Opinions are based on historical research and data believed reliable; there is no guarantee results will be profitable. Not responsible for errors or omissions. I may invest in the vehicles mentioned above.


