If this was a market with “normal” levels of liquidity, with the current level of fear and its oversold state, we would likely see a potentially tradeable bounce back in prices of some sort fairly soon. But it’s not a liquid market, thanks to the Federal Reserve.
Of course, even in its illiquid state, stocks will bounce back at some point. As I point out in the sections below, multiple indicators are now at levels which are associated with market reversals. Unfortunately, the odds of a lasting rally are low. And a reversal of note is unlikely unless certain things happen first.
Certainly, there are many intangibles at the moment which could cause unexpected positive vibes, such as a sudden and lasting peace in Ukraine, Mr. Powell feeling remorseful and calling the whole rate hike thing off, or the sudden discovery of an everlasting energy source which can double as food and which will be made immediately available free of charge to the entire world without any strings attached forever.
Yeah.
It’s the Fed. And Russia. And China. And Hurricane Season is Heating Up. And the Election is Getting Close. And Blah! Blah!
Fear is high, as are just too many things that can go wrong at the moment. And concerns about geopolitics and natural disasters are valid. But, at the end of the day, in the markets it’s all about liquidity. And with the Federal Reserve on the warpath, investors will have to think long and hard about taking chances on the long side for a while. This is due to the increasingly scarce amount of money in the system, aka liquidity, with which to trade stocks.
Last week, I noted that there was enough fear in the air to deliver some sort of a bounce. I also noted that “with enough fear in the air, nimble traders could make a go at any rally. But the reality is that any bounce may be cut short once the Fed delivers its next gut punch after its upcoming FOMC meeting, scheduled to end on 9/21.”
And what a gut punch it was, with the Fed not only raising the Fed Funds rate to a top range of 3.25% via a 75 basis-point increase, with the exclamation point being they aren’t likely to stop until they raise rates to 4.6%. As a result, stocks sold off quite violently.
All of which brings me to the real question for the moment: with enough fear in the air and with the market clearly oversold (see below for details), is there enough liquidity in the system for a bounce to actually materialize?
Rising Fear
Aside from the geopolitical and economic concerns, there are plenty of market gauges to keep an eye on
The widely quoted CNN Greed-Fear Index is now trading in the extreme fear region, hovering around 20The CBOE Put/Call Ratio is above 1.1, and The CBOE Volatility Index is back above 30.
All of these sentiment indicators are pointing to fear overtaking greed, which is usually when down trends reverse, even for short periods of time. Unfortunately, this rise in fear is coupled with a bit of a wrinkle.
Shrinking Liquidity Persists
Market rallies require a simple ingredient; money that’s willing to take a chance on the train wreck that’s left after a major decline. But money is understandingly cautious in the aftermath of a big selloff. As a result, there are three stages which the market generally passes through during a recovery.
To begin, the sellers have to be exhausted. Only when there is nothing left to sell with the buyers reappear. Then, the next stage of a rally comes from short covering. That’s when short sellers start to buy back the shares of companies they borrowed and sold in the hopes of buying them back at a lower price and pocketing the difference between the higher price where they sold the borrowed shares and the price after the decline. If the short covering rally is credible enough, the next wave of higher prices comes from the real buyers.
The summer rally in 2022 never reached the stage where buyers were fully convinced that the risk-benefit ratio was in their favor. As a result, it failed miserably after the short covering was exhausted.
The problem with the summer rally, and the current market, is that the Fed is taking out $95 billion from the financial system per month these days. They call it qualitative tightening (QT). They do this through the sale of treasury bonds and mortgage-backed securities on their balance sheet, which they bought when they did the reverse process during COVID – qualitative easing (QE).
The Bond Market Perspective
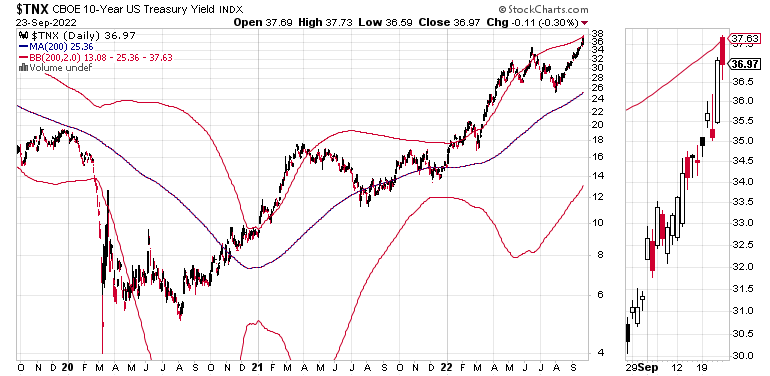
Three bond market charts give us a sterling picture of the liquidity situation. First, we see that the U.S. Ten Year note yield (TNX) has broken out above 3.75% and may be headed for 4% (and perhaps higher) at some point. Much of that rise in yields is the result of the Fed’s bond selling for its QT process.
Next, let’s look at the U.S. Two Year Note yield (UST2Y), which is now well above 4%. Again, this is a reflection of the Fed’s QT-related bond and note selling.
Finally, we look at the effect of QT on liquidity by reviewing the chart for the Eurodollar Index (XED). Eurodollars are dollar deposits in foreign banks that big money players use to make transactions which require rapid settlement. Some of the big players that use the Eurodollar system include trading houses and big hedge funds. Whenever they have extra money, they park it in Eurodollars so they have easy access and can make things happen fast.
When XED falls, it’s because big money players are using the money they would put in their Eurodollar slush fund to pay their bills. And that means that they can’t trade stocks at the same level that they normally would. Since XED is falling while bond yields are rising, it’s not difficult to conclude that the bounce in stocks may take a bit longer than usual to materialize. Note the close correlation between the rise in VIX, the fall in XED and the decline in SPX.
It’s also important to note that both TNX and the 2-Year Note yields are trading at or above their upper Bollinger Bands. Moreover, the 2-year note yield is extremely overbought, as its RSI has been above 70 for at least two weeks. That type of setup often precedes a reversal. If that happens, then we may get a small reprieve in stock prices.
Check out my recent Your Daily Five video on how to adjust your trading based on liquidity.
What’s the Bottom Line?
Three things have to happen before we get any kind of bounce:
The selling has to stopShort sellers have to cover their shorts aggressively enough to entice buyersBuyers have to take the bait and jump in aggressively
Until those three events occur, the odds of a meaningful rally are low. A second-best outcome would be that stocks start to move sideways.
When is it likely to end? When the Fed steps off the market’s throat.
Welcome to the Edge of Chaos:
“The edge of chaos is a transition space between order and disorder that is hypothesized to exist within a wide variety of systems. This transition zone is a region of bounded instability that engenders a constant dynamic interplay between order and disorder.” – Complexity Labs
Contrarian Bullish Signs Appear in NYAD and VIX
As I noted above, in order for markets to bottom, after the selling stops, short sellers follow by covering their shorts. Finally, buyers come in.
In the current market, as I describe below, short sellers have been relatively quiet in comparison to actual real sellers of stock (former buyers and holders), at least based on the S&P 500 (SPX).
This is illustrated by the general rise in the Accumulation Distribution (ADI) indicator, a reliable measure of short-selling activity, in comparison to the On Balance Volume (OBV), which is more indicative of real buying and selling.
Meanwhile, SPX continued to slice through support levels, as the very important 3900 area gave way easily and the selling mounted.
On the other hand, the New York Stock Exchange Advance Decline line (NYAD) is now officially oversold, with the RSI near 30 and the line itself trading well below the lower Bollinger Band (green lower line). What usually follows this type of setup is a move back inside the band – before the market decides what to do next.
At the same time, reinforcing my analysis above, VIX is very bearish (nearing a contrarian bullish level). Unfortunately, as the composite NYAD, SPX and XED chart shows, XED is nowhere near bullish, which means that even though fear and technical developments are ripe for a rally, money to fuel the rally may have become very scarce.
The Nasdaq 100 index (NDX) did no better, as it got crushed further after failing to bounce back to 13,000.
To get the latest up-to-date information on options trading, check out Options Trading for Dummies, now in its 4th Edition – Get Your Copy Now! Now also available in Audible audiobook format!
#1 New Release on Options Trading!
Good news! I’ve made my NYAD-Complexity – Chaos chart (featured on my YD5 videos) and a few other favorites public. You can find them here.
Joe Duarte
In The Money Options
Joe Duarte is a former money manager, an active trader and a widely recognized independent stock market analyst since 1987. He is author of eight investment books, including the best selling Trading Options for Dummies, rated a TOP Options Book for 2018 by Benzinga.com and now in its third edition, plus The Everything Investing in Your 20s and 30s Book and six other trading books.
The Everything Investing in Your 20s and 30s Book is available at Amazon and Barnes and Noble. It has also been recommended as a Washington Post Color of Money Book of the Month.
To receive Joe’s exclusive stock, option and ETF recommendations, in your mailbox every week visit https://joeduarteinthemoneyoptions.com/secure/order_email.asp.


