It was another tough period for the markets, with the S&P 500 posting its 2nd consecutive week of a 4.7% decline. Both weeks posted above-average volume as investors fled stocks amid signs that the Fed will continue to quickly raise rates, despite the real possibility of leading the U.S. into a recession.
Events globally are adding to anxiousness, with economic activity declining in Europe while a surging dollar is hitting already-weakened emerging economies. Russia’s implication that they may use nuclear weapons against Ukraine has also rattled nerves.
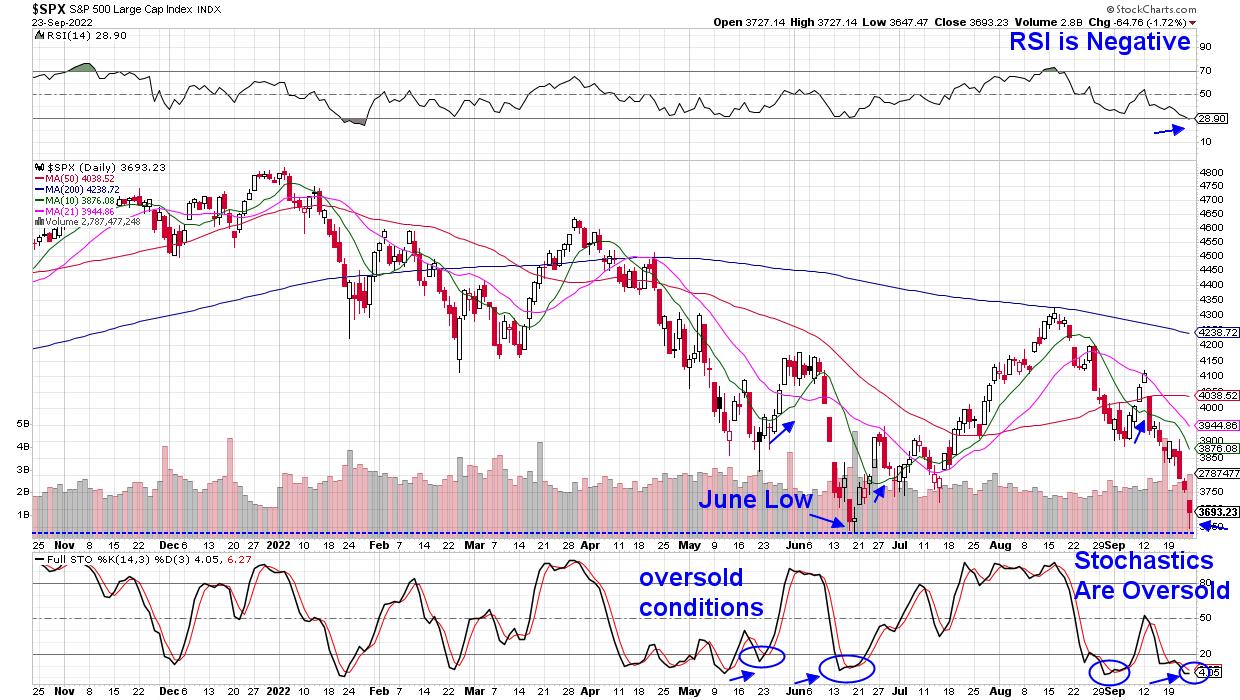
At this time, U.S. stocks are in a severe short-term downtrend that has put the markets into an oversold position similar to mid-May and mid-June. Both of those times, the S&P 500 staged a rally back up to key moving averages as buyers came in on the dip.
DAILY CHART OF S&P 500 INDEX
Things are different this time, however, as last week’s selloff puts the S&P 500 perilously close to breaking below its June lows. This 3636 level is widely viewed as the next area of possible support, and a break below that would likely spark further heavy selling, as it would signal that buyers have gone away. However, if the markets are able to find support at the June low, we could experience a sharp rally.
As for what could possibly drive the markets to find support at current levels and trade higher, next week, there will be no less than 15 appearances by Federal Reserve officials, including 2 separate occasions with Fed Chair Powell. Any hint of that the central bank may consider taking their foot off the pedal, with a lower percent hike at their next meeting, would certainly help.
Also up next week are 2nd-quarter GDP numbers, as well as key inflation data, with the August PCE Price Index due. Lower-than-anticipated numbers for either of these data points could also help bring back investors’ hope.
In the daily chart of the S&P 500 above, I’ve circled recent periods when the stochastics were oversold, which preceded a rally. Longer-term, however, the markets are in a confirmed downtrend, and any possible rallies should be viewed as short-term in nature.
While the current market conditions may be painful, the good news is that, when the markets stage a longer-term bullish uptrend, it will provide investors a tremendous opportunity. The beginning stages of a new bull period are historically the most profitable.
For those who would like to be alerted to when this possibility is setting up, take a trial of my MEM Edge Report for 4-weeks for a nominal fee. You’ll gain immediate access to my recent reports that will provide insights into sector rotation that taking shape.
On this week’s edition of The MEM Edge, now available to watch on demand at StockChartsTV.com and the StockCharts YouTube channel, I review areas that are withstanding the downtrend in the markets, as well as what’s driving price action elsewhere. I also share why the poorest performers this week may have further downside.
Warmly,
Mary Ellen McGonagle, MEM Investment Research


