Although the markets ended flat on a weekly note, the past five sessions remained quite volatile. The markets stepped into the week while inheriting a very weak global trade setup; the weakness was inflicted by very bearish reactions of the US markets following Jerome Powell’s comments at the Jackson Hole symposium on Friday. The Fed commented that it has all the intentions of continuing with a similar quantum of rate hikes until the macroeconomic figures return to the desired levels. This saw the global markets getting weaker; the Indian markets also suffered a gap down opening at the beginning of the week. However, all our gap-down openings were ultimately bought into and this kept the markets within the broad range and above their crucial supports. After oscillating in a broad range of 611.45 points, the headline index closed flat with a negligible loss of 19.45 points (-0.11%) on a weekly note.
Regardless of the reasons that we associate with the market reactions, the markets have defined a clear range for themselves from a technical perspective. First, the NIFTY has not been able to move above the falling trend line pattern resistance that begins from the lifetime high point of 18600 and joins the subsequent lower tops. Secondly, the NIFTY has rebounded from the levels very close to the 50-Week MA which is placed at 17135. This defines a broad trading zone of 17100-17650 levels for the NIFTY. The volatility index, INDIAVIX, spiked; it rose by 7.33% to 19.55 on a weekly basis.
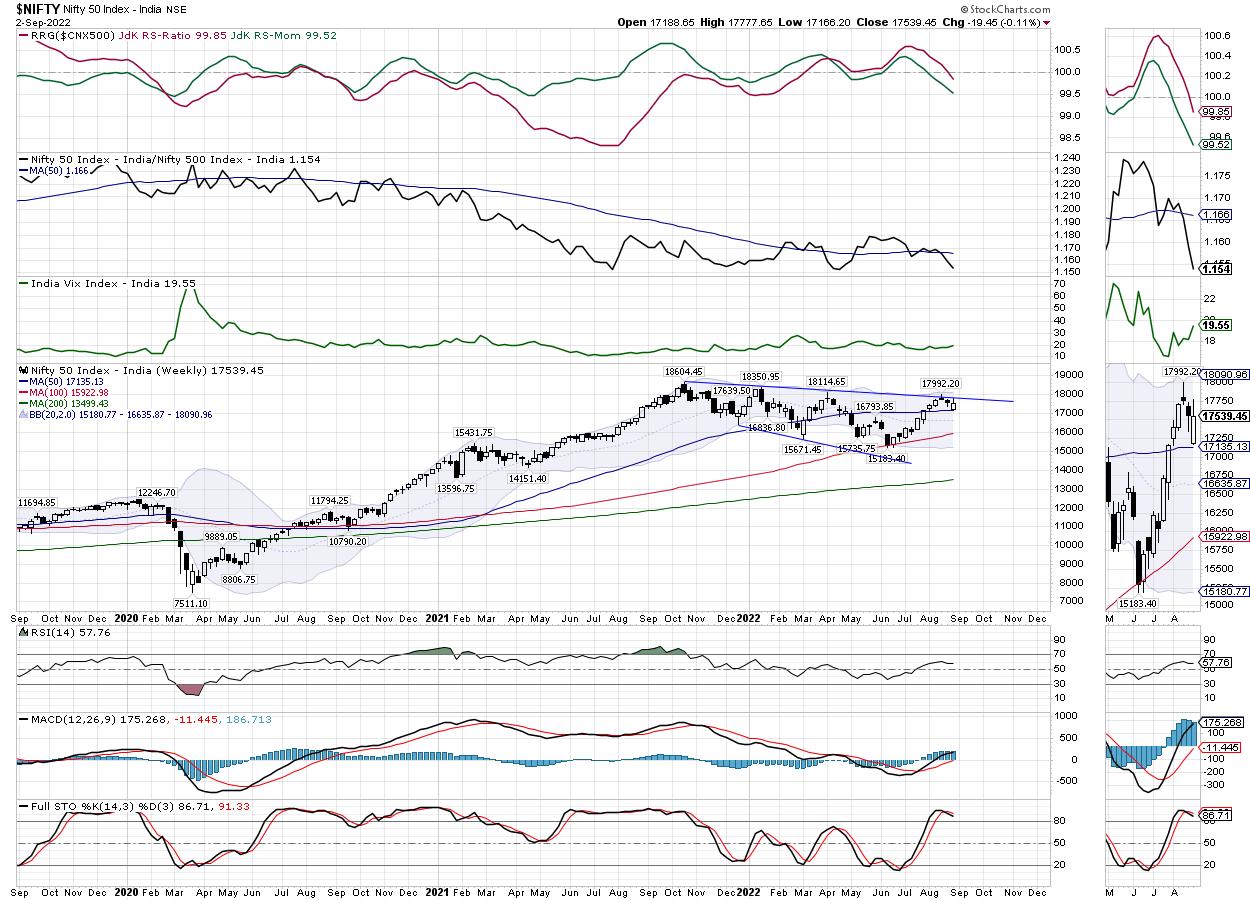
The coming week is all set to be within a defined range; the levels of 17650 and 17790 will act as potential resistance points. The supports come in at 17380 and 17200 levels.
The weekly RSI stands at 57.76; it remains neutral and does not show any divergence against the price. The weekly MACD is bullish and stays above the signal line. No major formations are seen on the candles.
The pattern analysis of the weekly chart shows that the NIFTY has continued to resist the falling trend line pattern resistance. This is a significant pattern resistance as it begins from the lifetime high point of 18600 and joins the subsequent lower tops. On the lower side, the NIFTY has rebounded from the levels very near to the 50-Week MA. The 50-Week MA is presently at 17136. This defines the broad trading range for NIFTY between 17100-17700 levels.
As per the current technical setup, any sustainable directional move will occur only if the NIFTY moves past 17700 levels or slips below 17100 on a closing basis.
A directional bias would be established only if the NIFTY moves past 17700 or slips below 17100 levels. Unless that happens, we will see the markets oscillating back and forth in this defined range. It is also very much likely that the markets stay highly stock-specific; the key to navigating such markets would be to find those stocks that have a stronger or at least an improving relative strength against the broader markets. A highly selective approach is advised for the coming week.
Sector Analysis for the coming week
In our look at Relative Rotation Graphs®, we compared various sectors against CNX500 (NIFTY 500 Index), which represents over 95% of the free float market cap of all the stocks listed.
The analysis of Relative Rotation Graphs (RRG) shows that the Metal Index has rolled inside the improving quadrant. This markets a potential end to the relative underperformance of this group. NIFTY Realty, PSU Banks, Banknifty, MidCap 100, and Financial Services Indices are firmly placed inside the improving quadrant. The Consumption Index is also inside the leading quadrant but it is seen giving up on its relative momentum against the broader markets.
While the NIFTY FMCG index has moved ahead in the weakening quadrant, the Auto Index has just rolled over inside the weakening quadrant.
NIFTY Media, Pharma, and the IT Index continue to languish inside the lagging quadrant. The Infrastructure, Energy, Commodities, and PSE Indices are also inside the lagging quadrant, but they appear to be improving on their relative momentum against the broader NIFTY500 Index.
NIFTY Services sector index remains inside the improving quadrant.
Important Note: RRG™ charts show the relative strength and momentum for a group of stocks. In the above Chart, they show relative performance against NIFTY500 Index (Broader Markets) and should not be used directly as buy or sell signals.
Milan Vaishnav, CMT, MSTA
Consulting Technical Analyst
www.EquityResearch.asia | www.ChartWizard.ae