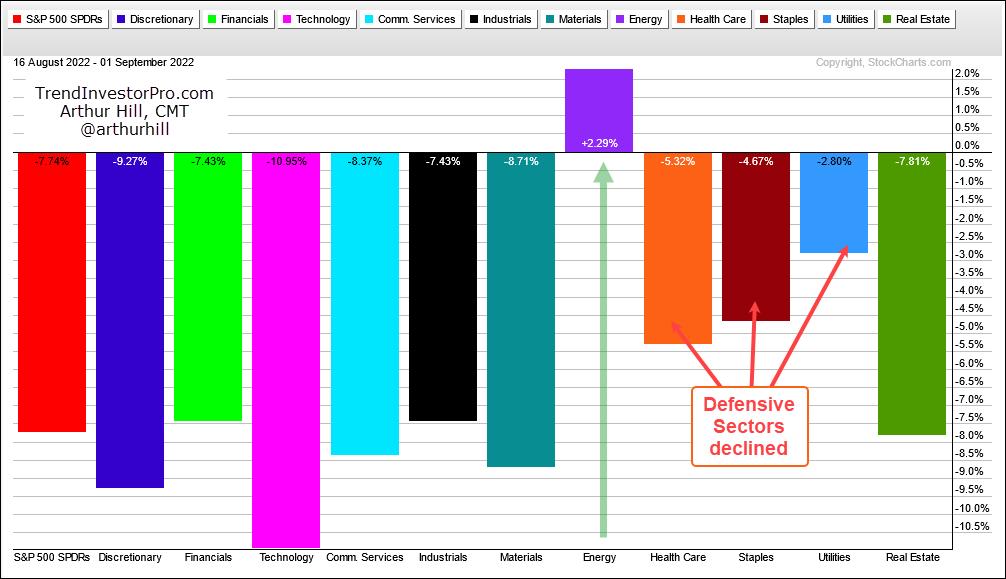
The short-term trends for the big three are down (SPY, QQQ, IWM) and we are in a bear market. Over the last two weeks, the short-term trend (down) aligned with the long-term trend (down). This is a powerful combination that can lead to rising correlation among stocks. Note that downside participation broadened over the last twelve days (16-Aug to 1-Sep) with ten of the eleven sectors losing ground. As the PerfChart below shows, XLE was the only sector showing a gain during this period.
The defensive sectors held up better than SPY by declining less, but they still succumbed to broad market weakness and fell. Now let’s look at the swings over the last few months. Note that SPY fell over 20% from early April to mid June, advanced some 17% from mid June to mid August and then fell around 8% from mid August to early September. These are big swings in relatively short timeframes.
The PerChart below shows how some of the so-called defensive groups performed during this timeframe. This list includes the Utilities SPDR (XLU), Infrastructure ETF (IFRA), Consumer Staples SPDR (XLP), Food & Beverage ETF (PBJ), Select Dividend ETF (DVY), Water Resources ETF (PHO) and Healthcare SPDR (XLV). I would also throw in the Aerospace & Defense ETF (PPA).
Notice how these lines pretty much move in unison (red and green arrow-lines). In particular, all rose from mid June to mid August and fell from mid August to early September. So called “defensive” groups may hold up better, but they are still correlated to the broader market and not immune to broad market weakness. Investors looking for true diversification and alternatives need to look outside of the stock market. Here at TrendInvestorPro, we become very selective during bear markets and turn our focus to the non-stock ETFs that are in uptrends or have bullish looking charts. Click here for immediate access to our commentaries, videos and strategies for ETFs.
Does the 200-day SMA actually work for SPY, QQQ, MDY and IJR? It does for one of these ETFs, but not so well for two others. In this Next Level Charting video, we put this long-term moving average do the test and show some tweaks to improve performance.
Looking for a charting edge? The TIP Indicator Edge Plugin for StockCharts ACP has eleven indicators to help you identify the trend, trail a stop, find pullbacks within uptrends and more. Click here to take your analysis process to the next level.
—————————————