The short-term trend for stocks has turned decidedly up, as a combination of short-covering, corporate stock buybacks and seasonal end-of-month buying hit simultaneously.
The market breadth has been quite good (see NYAD data below). Especially bullish is the fact that, all of a sudden, there are lots of price charts which are nearing some sort of breakout point. Moreover, as short-selling accelerates, there are some hopeful signs that real buyers are starting to come back as well. Still, there are some key resistance levels that are close to being tested, which means we could see a pullback or consolidation in the next few days.
And yes, the Fed could easily say something that kills the whole thing.
Did the Fed Turn Dovish?
The Federal Reserve raised interest rates on 7/27/22, and U.S. GDP came in with a 0.9% decrease for the second-quarter, technically signaling a recession. The stock market rallied, with the most notable development being that the 4000 price area on the S&P 500 (SPX) is no longer critical resistance, but critical support.
Fed Chairman Powell, in his press conference, said the amount of the Fed’s next rate increase will be “data dependent.” The market took that as a dovish turn. The net result was another short squeeze, with reports suggesting that the majority of hedge funds were positioned for a major decline in stocks after the Fed pulled the trigger.
This rally should not be surprising. As I’ve noted here over the last few weeks, the market’s breadth, as measured by the New York Stock Exchange Advance Decline line (NYAD) had turned neutral to bullish, along with the major indices reaching critical price chart decision points.
But who looks at price charts these days, right?
Buybacks and Bullish Technicals
So, let’s update where we are at the moment:
NYAD has delivered a short-term breakoutSPX is above 4000, and its 50-day moving average with resistance at 4200-4300, but;On Balance Volume is starting to riseLiquidity is stable, but not rising.
Thus, we are still being powered higher by a short squeeze, although buyers are starting to dip their feet in the water.
Energy Sector Nears Bursting Point as Supply Issues Multiply
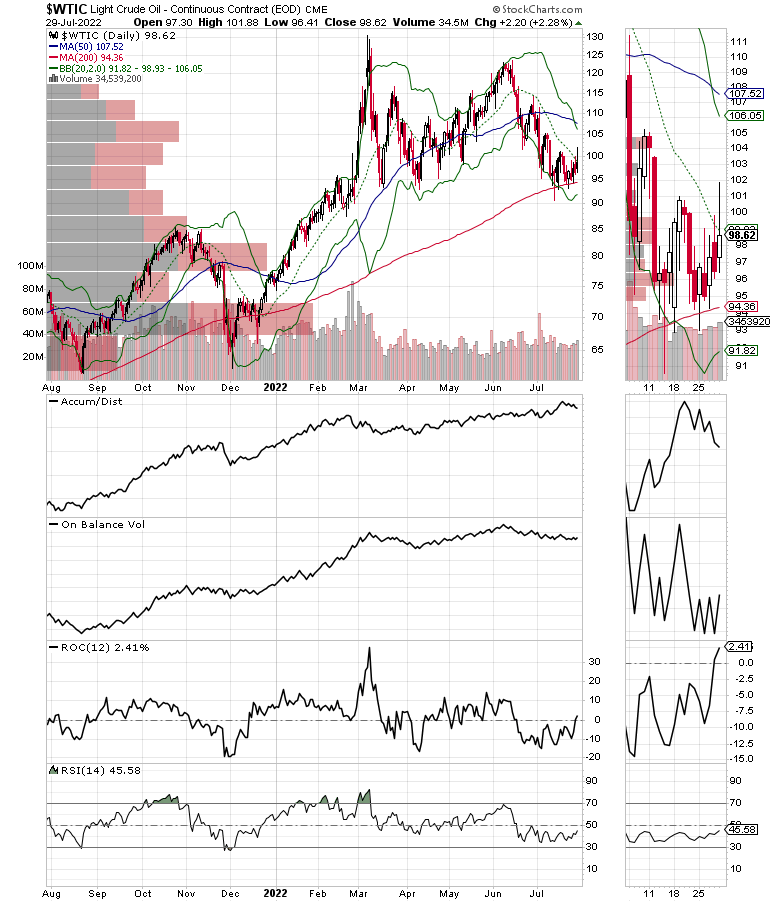
The price of West Texas Intermediate Crude Oil (WTIC) has given back over 20% of the gains it made as a result of the Russian invasion of Ukraine. Most of this has been due to traders handicapping the odds of a recession. But as winter approaches and we enter the more active part of hurricane season, oil prices are finding support. All of which means that prices are poised to move higher in response to unforeseen events as they develop.
Of course, the central tenet of any commodity market is supply, which, regardless of recession fears, remains tight. Here are recent oil supply figures from the U.S. Energy Information Agency (EIA):
U.S. commercial crude oil inventories (excluding those in the Strategic Petroleum Reserve) decreased by 4.5 million barrels from the previous week;Current U.S. crude oil inventories are about 6% below the five-year average for this time of year.
Meanwhile, on the product side, things are no better, and, in the case of distillate (diesel), supplies are significantly below the norm. Specifically:
Total motor gasoline inventories (finished gasoline and blending components) decreased, with gasoline inventories coming in at 4% below the five-year average;Distillate inventories are about 23% below the five year average;Propane/propylene inventories increased by 2.6 million barrels, but are about 12% below the five-year average.
Furthermore, production is still falling behind demand, as total commercial petroleum inventories decreased by 3.3 million and total products supplied over the last four-week period averaged 20.0 million barrels a day, down by 2.9% from the same period last year. Meanwhile, gasoline production was down by 7.1% year-over-year.
As a result, money is moving back into crude oil as natural gas pulls back slightly in expectation of a mild cooling of temperatures in the U.S.
Natural Gas Volatility is Likely to Increase
As we went to press, reports hit the wire that Russia has cut off natural gas supplies to Latvia. This is likely to add the uncertainty in the market.
The odds of a long lasting downward move in NATGAS are well below average, given the uncertainty in Europe, where, just when things couldn’t get any worse, news broke last week that the German government is adding a new “levy” – translation: tax – in order to bail out the electric utilities and natural gas importers and distributors this winter.
This is expected to increase natural gas bills in Germany by “hundreds of Euros,” according to Germany’s Economic Minister Robert Habeck. On the flip side, there are expectations for fuel subsidies to lower-income households.
But an interesting development is occurring in the exploration and production sector (DJSOEP), which has recently found support at its 200-day moving average and is testing resistance at its 50-day. If, as I expect, it takes out this resistance area, it will likely move back toward its old highs.
So the bottom line is that, with tight supplies of both crude and products, any further disruption, such as one caused by a hurricane which cripples refineries, pipelines, and extraction platforms in the Gulf of Mexico for any extended period of time, could lead to a rapid increase in oil and natural gas prices.
I recently recommended a two very attractive energy stocks. You can check it out with a FREE trial (click here).
Welcome to the Edge of Chaos:
“The edge of chaos is a transition space between order and disorder that is hypothesized to exist within a wide variety of systems. This transition zone is a region of bounded instability that engenders a constant dynamic interplay between order and disorder.” – Complexity Labs
NYAD Breaks Out as SPX Takes Out Resistance at 4000
Stocks are back in a short-to-intermediate-term uptrend, with some hopeful signs emerging, as buyers are stepping in while short covering continues.
The NYAD Advance-Decline line (NYAD) moved decidedly higher last week, building on its move above its 50-day moving average, which held nicely. The major indexes confirmed the move. The CBOE Volatility Index (VIX) has broken to a new low as the bears are bailing out of their put option hedges.
XED is forming a base, a sign of stable, but low, liquidity. This can’t last forever, which means that either XED turns up or NYAD turns down.
The S&P 500 (SPX) cracked the ceiling and moved well above 4000, with 4200-4300 being the next big resistance level. Accumulation Distribution (ADI) is still rising, which means short-covering is ongoing. A turn up in On Balance Volume (OBV) is also starting to materialize, which means buyers are coming in. This could well extend the rally.
The Nasdaq 100 index (NDX) delivered a short-term breakout, also building on its recent move above its 50-day moving average, with 12500 now becoming stronger support. A clear break above 13000 would likely take NDX close to 14000. Accumulation Distribution (ADI) is suggesting short sellers are still stampeding out and On Balance Volume (OBV) is strengthening as buyers come in.
Which is the best-looking tech stock at the moment? Find out with a FREE trial to my service (click here) and learn more about my risk-averse approach to trading stocks.
The Nasdaq 100 index (NDX) also crossed above its 50-day moving average, but failed its first attempt to rise above 12500. Accumulation Distribution (ADI) and On Balance Volume (OBV) are improving.
To get the latest up-to-date information on options trading, check out Options Trading for Dummies, now in its 4th Edition – Get Your Copy Now! Now also available in Audible audiobook format!
#1 New Release on Options Trading
Good news! I’ve made my NYAD-Complexity – Chaos chart (featured on my YD5 videos) and a few other favorites public. You can find them here.
Joe Duarte
In The Money Options
Joe Duarte is a former money manager, an active trader and a widely recognized independent stock market analyst since 1987. He is author of eight investment books, including the best selling Trading Options for Dummies, rated a TOP Options Book for 2018 by Benzinga.com and now in its third edition, plus The Everything Investing in Your 20s and 30s Book and six other trading books.
The Everything Investing in Your 20s and 30s Book is available at Amazon and Barnes and Noble. It has also been recommended as a Washington Post Color of Money Book of the Month.
To receive Joe’s exclusive stock, option and ETF recommendations, in your mailbox every week visit https://joeduarteinthemoneyoptions.com/secure/order_email.asp.


