


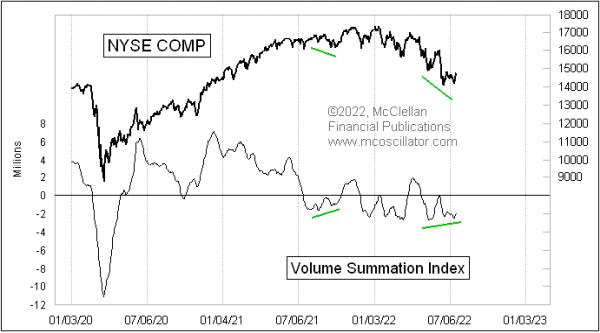
If we look at the classic version of the McClellan Volume Summation Index in this week’s chart, then there is some reason for the bulls to have hope.
There is a slight bullish divergence right now, with prices having made a lower low, but the Summation Index has made a slightly higher low (at least for the moment). However, digging deeper, the message gets more complicated. The Volume Summation Index is very similar to the McClellan A-D Summation Index, for which we are more familiar, which is calculated off of the numbers of Advances minus Declines. Both tools were developed by my parents, Sherman and Marian McClellan, back in 1969. The difference is that the Volume Summation Index uses the daily difference between NYSE Up Volume and Down Volume to drive the calculations.
First there is a McClellan Volume Oscillator, calculated as the difference between a 10% Trend and a 5% Trend of the daily Up-Down Volume difference. See this link for a description of the calculations. Then, the Volume Summation Index is an ongoing running total of past Volume Oscillator readings. So the Volume Summation Index will change each day by the value of the Volume Oscillator.
The Volume Summation Index will generally go up and down as prices go up and down. But how far it goes can carry an important message. And that is where we finally get to the topic of this week’s posting.
That little bullish divergence that is evident in the classic Volume Summation Index is not evident in the Ratio-Adjusted Volume Summation Index, which can be abbreviated as a Volume RASI. While the number of issues traded is relatively consistent on a day to day basis, and drifts somewhat over long periods of time, it is a different story with the volume numbers. Those can vary a lot from day to day, which can greatly affect the amplitudes of indicators based on those Up and Down Volume numbers.
The RASI factors out changes in the number of issues or the amount of volume traded over time. See this link for calculation details. And, in doing that, the Volume RASI can reveal messages that the regular Summation Index does not show us.
Back in August 2021, the Volume RASI agreed with the bullish divergence that we saw in the classic Volume Summation Index. But it disagrees right now, showing a continuing progression of lower highs and lower lows. So not much hope for the bulls in this version.
The Volume RASI also shares a property with the A-D RASI, in that it can show bullish strength when it is able to climb up above its +500 level. The higher it goes above +500, the stronger the message. Perhaps more importantly, it shows a lack of strength when it fails to get up above +500 on a rally attempt, and that is what we are seeing all during 2022. Each countertrend rally attempt has seen the Volume RASI fall short of reaching the +500 level, telling us that the bears are in charge and the bulls cannot achieve “escape velocity” in their rally attempts.
So which version of the Volume Summation Index is the “better” one, the RASI or the classic? That depends upon how one uses either of them. The important message is that each can be useful, and when they disagree it is a noteworthy condition to which we should pay attention.


